83
Tecnología y Ciencias del Agua
, vol. VIII, núm. 2, marzo-abril de 2017, pp. 77-91
Mao
et al.
,
The runoff variation characteristics of Dongting Lake in China
ISSN 2007-2422
•
of four rivers. The maximum
C
v
of three bayous
is 0.761 in Ouchikou and that of four rivers is
0.277 in Shimen.
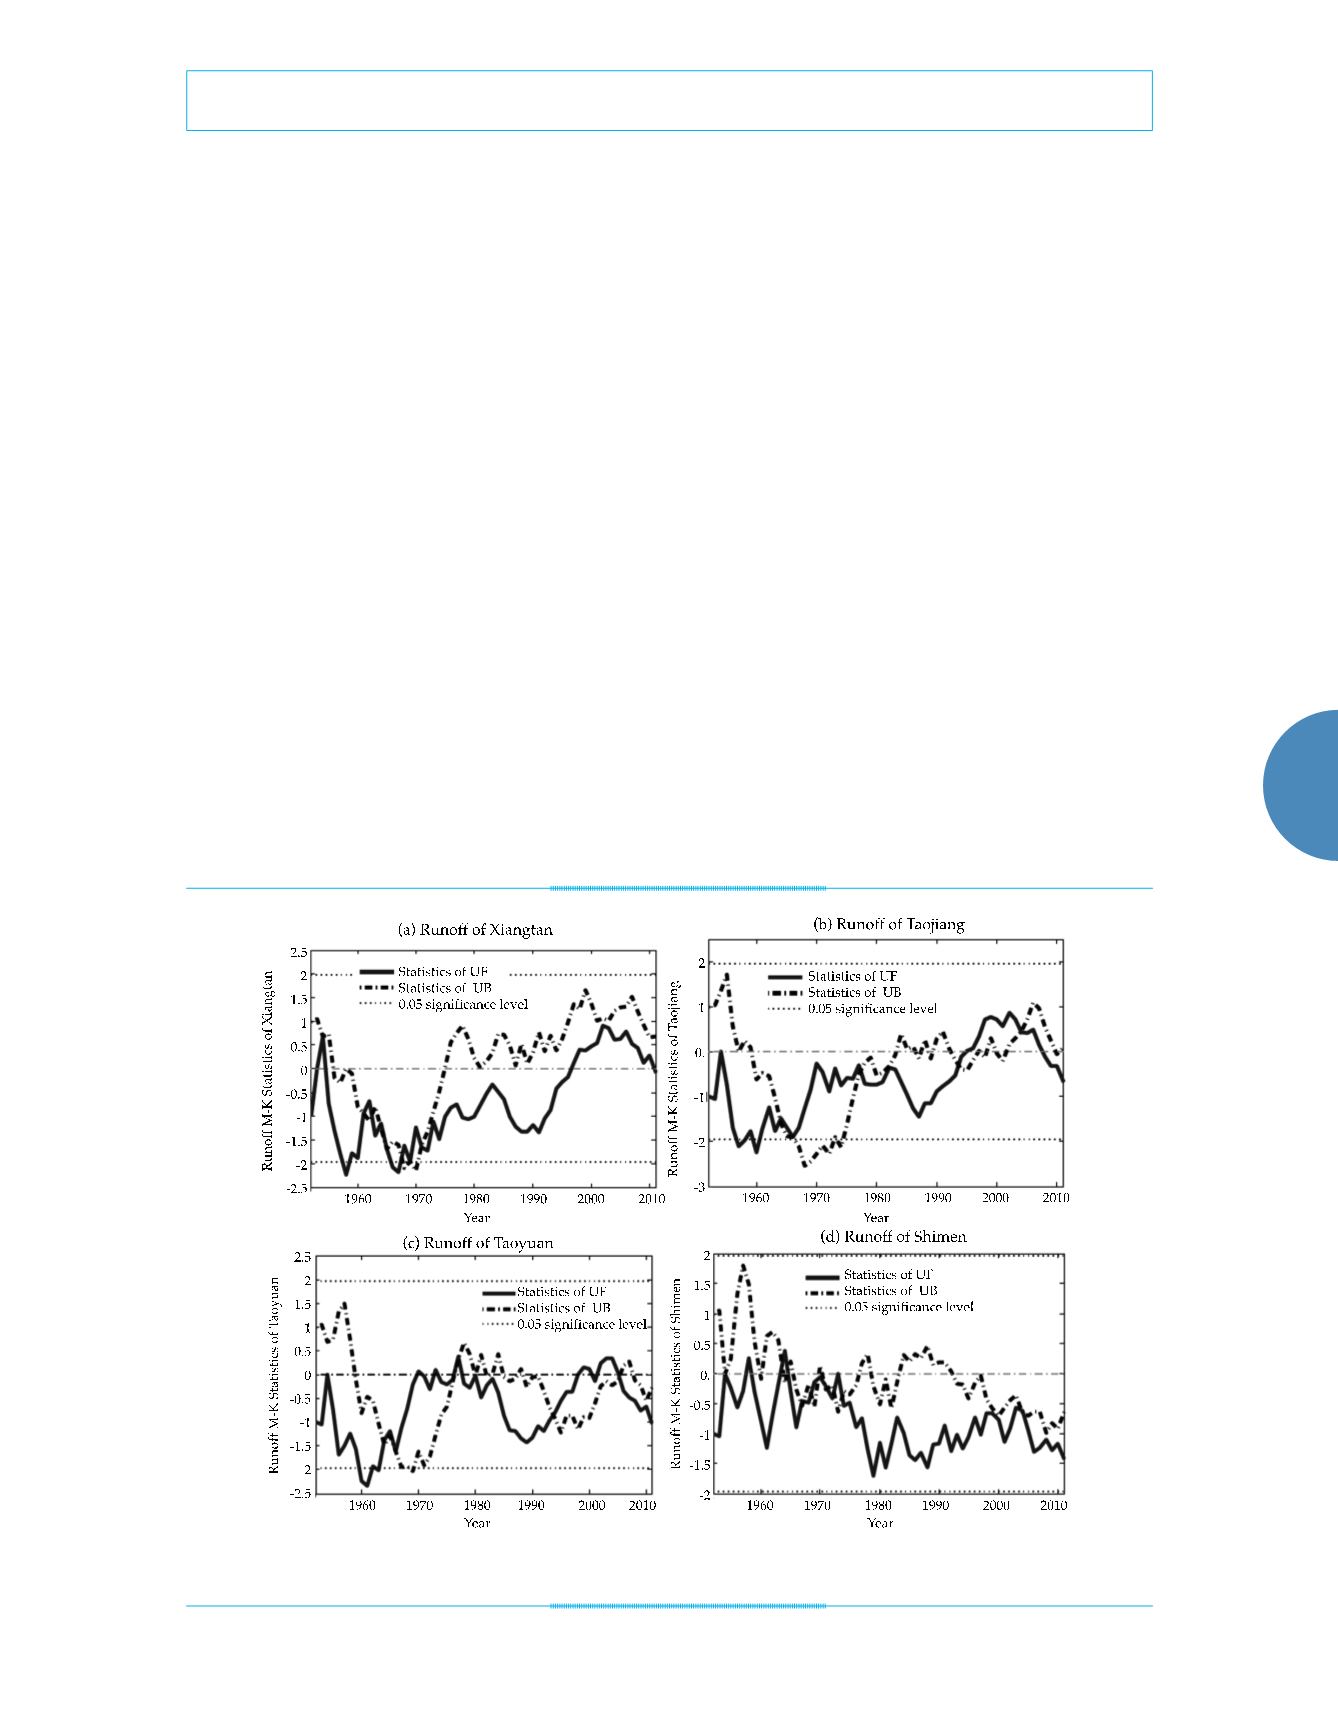
Runoff trend analysis
There are many methods to diagnose the con-
tinuous hydrological sequence. The most widely
used and simple intuitive ways are moving
average method and Mann-Kendall (marked
by M-K) trend test method. This paper analyzes
Dongting Lake’s inflow and outflow with M-K
trend test method which is widely accepted by
a hydrologist. This method does not assume the
distribution form for the data under investiga-
tion, only provided it is random independent
with its time. The statistical significance of the
trend was assessed at the 5% in this paper.
Figure 3(a) shows four crosses of UF and
UB within the confidential interval. Based on
the statistical significance of M-K mutation
test, 1995, 1980, 1983 and 1987 were possible
runoff mutation time of Xiangtan. From 1957 to
1994, UF curve was below the zero line within
the confidential thresholds which explained a
downward but not obvious trend in its runoff. In
fig. 3(b), UF statistic curve and UB statistic curve
for 5 times within the confidential intervals;
1955, 1962, 1967, 1972 and 1978 were potential
mutation time for Zi River. From 1956 to 1993,
Taojiang’s runoff performed downward but not
significant trend while in the rest of the time it
was on the rise. Taoyuan’s UF and UB have seven
crossover points within the confidential intervals.
The abscissa value of these points was likely to
appear during mutation moments. An unobvious
descent trend occurred from 1956 to 1967, 1985 to
1995 and 2007 to 2011. In figure 3 (d), Shimen’s
runoff trend was more complex than others.
UF and UB coincided a lot in the confidential
intervals and fluctuated. Its runoff went upward
in 1951-1975 and declined in 1976-2011.But the
trend was not significant for its crossovers were
located in the confidential intervals.
Figure 3. The M-K trend analysis of runoff of Four Water basin in Hunan.


