81
Tecnología y Ciencias del Agua
, vol. VIII, núm. 2, marzo-abril de 2017, pp. 77-91
Mao
et al.
,
The runoff variation characteristics of Dongting Lake in China
ISSN 2007-2422
•
distribution of monthly runoff annually and
discovered water distribution characteristics of
rivers in China (Tang, Cheng, & Li, 1982). Then,
this method was adopted in other different
basins (Zhang & Qian, 2003; Ding, Xu, & Pan,
2010; Zhang & Lu, 2011; Bai, Chin, & Ma, 2012).
Concentration degree reflects the non-uniform
distribution characteristics while concentration
period informs the runoff concentrated period
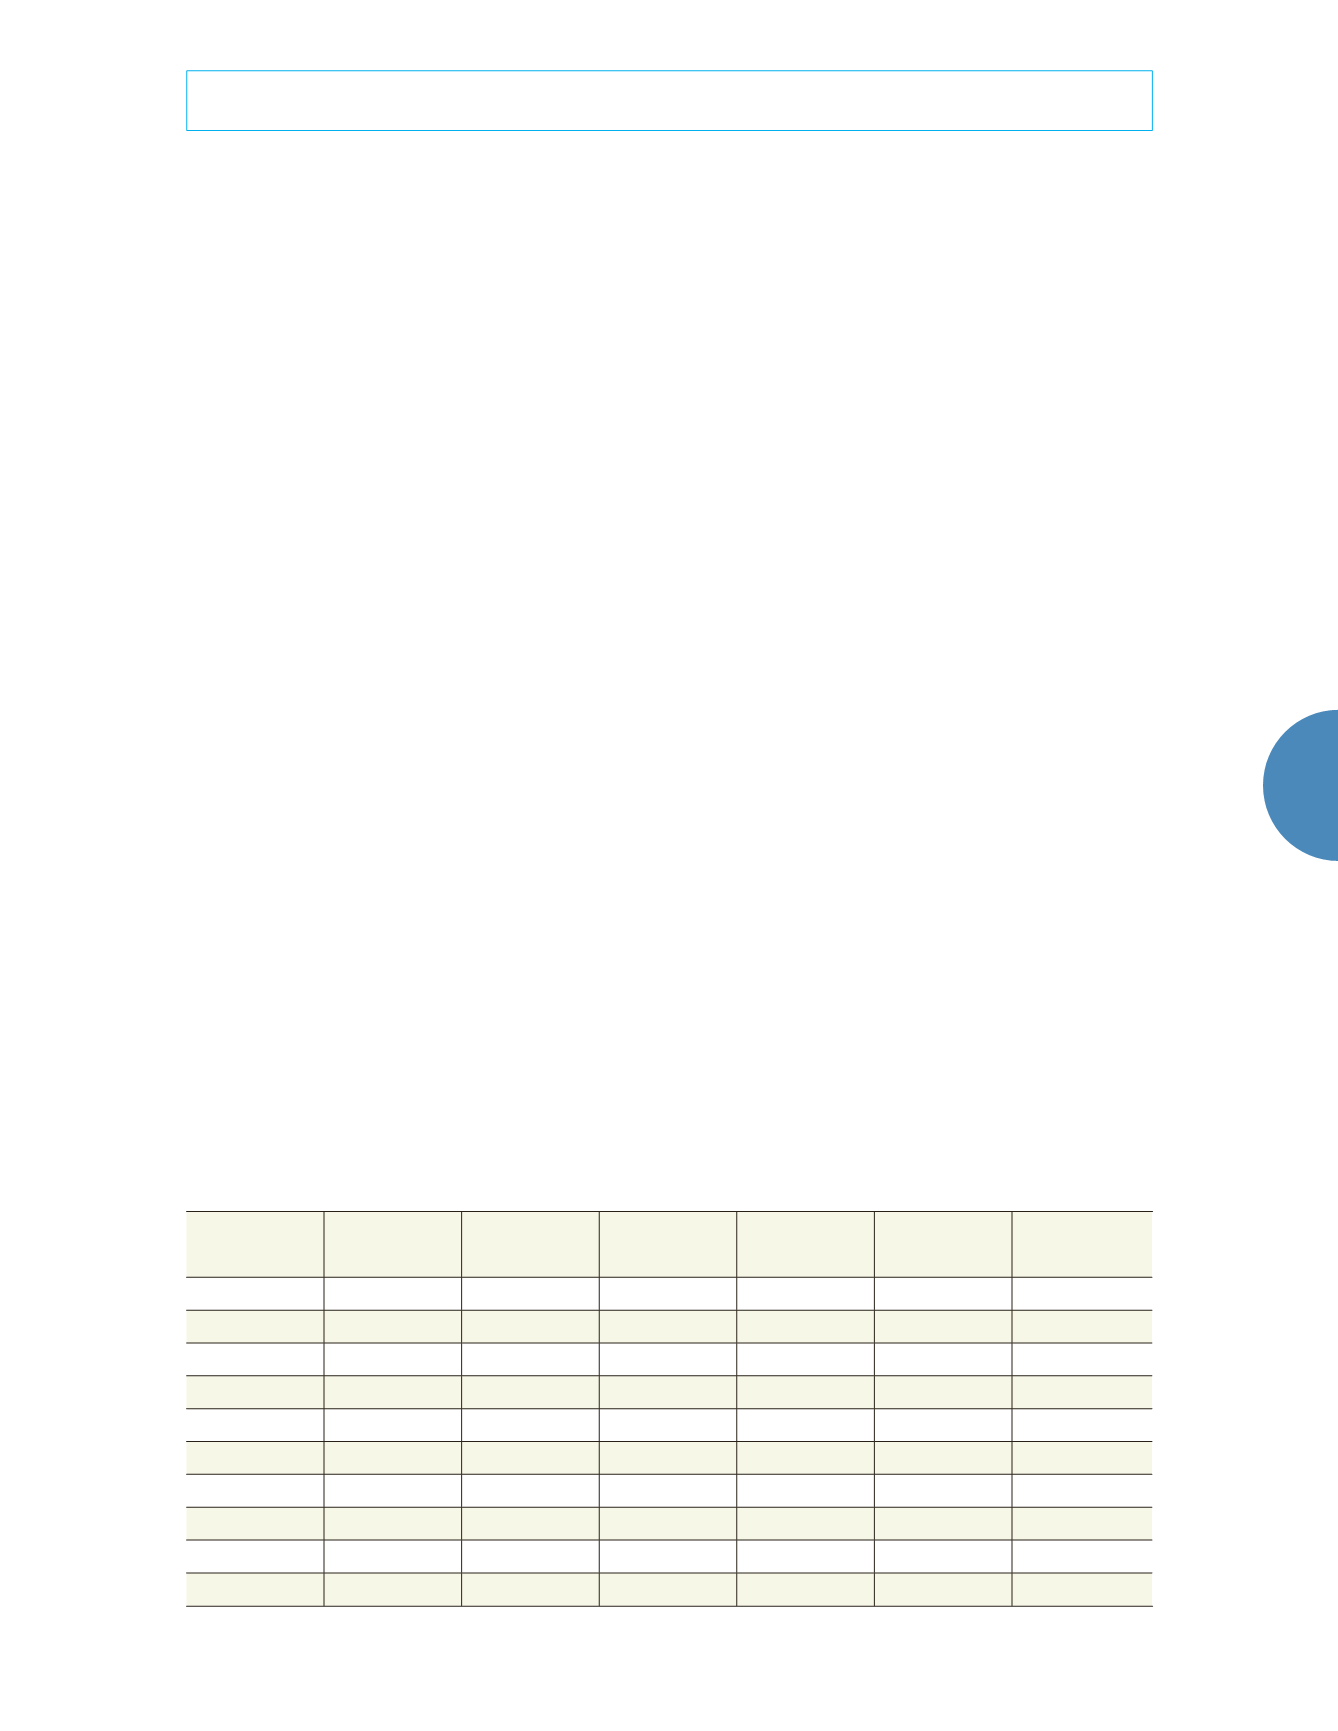
(monthly). The results are shown in table 1.
Table 1 illustrates the heterogeneity distribu-
tion of inflow and outflow. Distribution of three
bayous’ annual runoff is uneven for its concen-
tration degree is between 66.9 and 85.2%. The
maximum is in Kangjiagang and the minimum
is in Xinjiangkou. Four rivers’ concentration de-
gree is between 32.2 and 43.7% and Chenglingji
is 37.8% which is the smallest. Concentration
period of three bayous and Chenglingji is July
and that of four rivers is May-July. Their con-
centration period’s synthesis vector direction is
between 103.2° and 190.2. Statistic results and
measured reality are in phase. Judging from
the runoff variation amplitude, Ouchikou is
the largest and Taojiang is the smallest. Abso-
lute variation amplitude difference lies in each
river. Maximum variation is 402.5 × 10
8
m
3
of
Chenglingji outflow and Kangjiagang is the
smallest of 7.3 × 10
8
m
3
. Of the four rivers, ab-
solute runoff change of Xiangtan and Taojiang
are generally inconsistent, while that of Taoji-
ang and Shimen are with the same trend. This
consistency has a close relationship with their
catchment area. The Bigger area corresponds
with the larger change rate of runoff.
Figure 2 gives an overall good consistency
of annual runoff variation from four rivers and
three bayous. FromApril to May, four rivers be-
gin their rain period and runoff increase rapidly
and peak in late May-early June, in the form of
a single symmetrical peak.
Among all, Xiangtan and Taoyuan have
larger peaks. Three bayous step into flood sea-
son in May-June. Their runoff peak out in July.
Among them, the west branch of Songzikou
and Ouchikou have larger peaks. The outflow
at Chenglingji is alternately affected by flood
peaks from three bayous and four rivers,
experiencing a relatively longer flood period.
It enters into flood period from April to May
and then experiences a larger flow period from
June-August. Flood peaks appear in late June-
early July. The flood peak times is between that
of three bayous and four rivers and disappears
by the end of August. After a linear decrease,
Dongting Lake enters into the dry season.
Concentration period of runoff in Dongting
Lake is June-July of each year and the maximum
runoff occurs in late June-early July. Flood hap-
pens in late July mostly. Zeng
et al.
analyzed
Table 1. Statistic characteristics of annual runoff in Dongting Lake’s inflow and outflow.
Hydrological
Station
Time scale
(year)
Concentration
Degree (%)
Synthesis
vector
Direction (°)
Mont
h
Relative
change
Absolute
change (10
8
m
3
)
Xingjiangkou
1955-2011
66.9
175.4
July
166.8
70.0
Shadaoguan
1955-2011
75.1
181.1
July
639.9
28.6
Mituosi
1955-2011
69.3
179.6
July
362.0
36.9
Kangjiagang
1955-2011
85.2
190.2
July
/
7.3
Guanjiapu
1955-2011
75.3
178.9
July
2626.3
80.4
Xiangtan
1956-2011
38.2
106.5
May
5.0
91.1
Taojiang
1956-2011
32.2
103.2
May
3.8
25.8
Taoyuan
1956-2011
41.0
145.3
June
6.1
94.8
Shimen
1956-2011
43.7
180.4
July
8.9
24.5
Chenglingji
1951-2011
37.8
170.1
July
6.7
402.5


