79
Tecnología y Ciencias del Agua
, vol. VIII, núm. 2, marzo-abril de 2017, pp. 77-91
Mao
et al.
,
The runoff variation characteristics of Dongting Lake in China
ISSN 2007-2422
•
and four rivers) variation and drought and flood
disasters based on the hydrological database.
Data and methodology
Data
Hydrological database from 1951 to 2011 has
been used in this study which was collected
from hydrological stations on the following riv-
ers: Songzikou (Xinjiangkou and Shadaoguan),
Taipingkou (Mituosi), Ouchikou (Kangjiagang
and Guanjiangpu), Xiang River (Xiangtan), Zi
River (Taojiang), Yuan River (Taoyuan), Li River
(Shimen), Chenglingji (Qilishan). Monthly data
series were used to analysis annual characteris-
tics. All these data were obtained from Hunan
Hydrology Bureau and
Bulletin of the Yangtze
River Sediment
during 2000 and 2011.
Methodology
Mann-Kendall trend test method
Mann-Kendall (M-K) trend test method is usu-
ally used for identification the mutation charac-
teristic of a long time series data (Wang, Zhou,
& Tang, 2011; Zhang, Chen, & Jiang, 2008). M-K
trend test method is widely recognized which
does not require the original data obeying cer-
tain probability distribution and require only
submitted random independence. Set the time
sequence
x
1
, x
2
, x
3,…
, x
n
,
m
i
represent the cumula-
tive amount that the
i
sample
x
i
is greater than
x
j
(1 ≤
j
≤
i
). Defined the statistical magnitude:
dk
=
m
i
i
k
2
n
(
)
k
(1)
If the original sequence is random and
independent, the mean and variance of
dk
re-
spectively are, E[
dk
] =
k
(
k
- 1)/4, var[
dk
] =
k
(
k
- 1)
(2
k
+ 5)/72 (2 ≤
k
≤
n
). Further standardization of
dk
, defined statistic
UF
k
= (
dk
- E[
dk
])/
]
var [
dk
(
k
= 1, 2, 3,…,
n
). If
k
> 10,
UF
k
converges to the
standard normal distribution. Adopt bilateral
trend test, given a certain significant level
a
(
a
= 0.05). Check the critical value of
U
a
/2
in
the normal distribution table, If
|
UF
k
|
<
U
a
/2
, it
indicate that the tendency is not obvious;
If
UF
k
|
>
U
a
/2
, it indicated that there is a signifi-
cant trend change. If the
UF
k
value is positive,
the long series shows increasing trend and vice
versa. Make the inverse time series of
x
repeated
computation according to the above process, at
the same time make
UB
k
= -
UF
k
(
k
=
n
,
n
-1,…,
1). The two curves of
UB
k
and
UF
k
cross at one
point, and the cross point is mutation point. If
the mutation point is located between the given
confidence level of 95%, it means mutation time
is significant in statistics.
Concentration degree and concentration period
method
The calculation principle of concentration de-
gree and concentration period method follows
(Liu, Li, & Su, 2007): to add the monthly runoff
value up in terms of the vector sum in a year.
The ratio of the modulus of resultant vector and
annual runoff is the annual runoff concentration
degree (
R
d
). The annual runoff concentration pe-
riod (
R
p
) is the direction of the resultant vector.
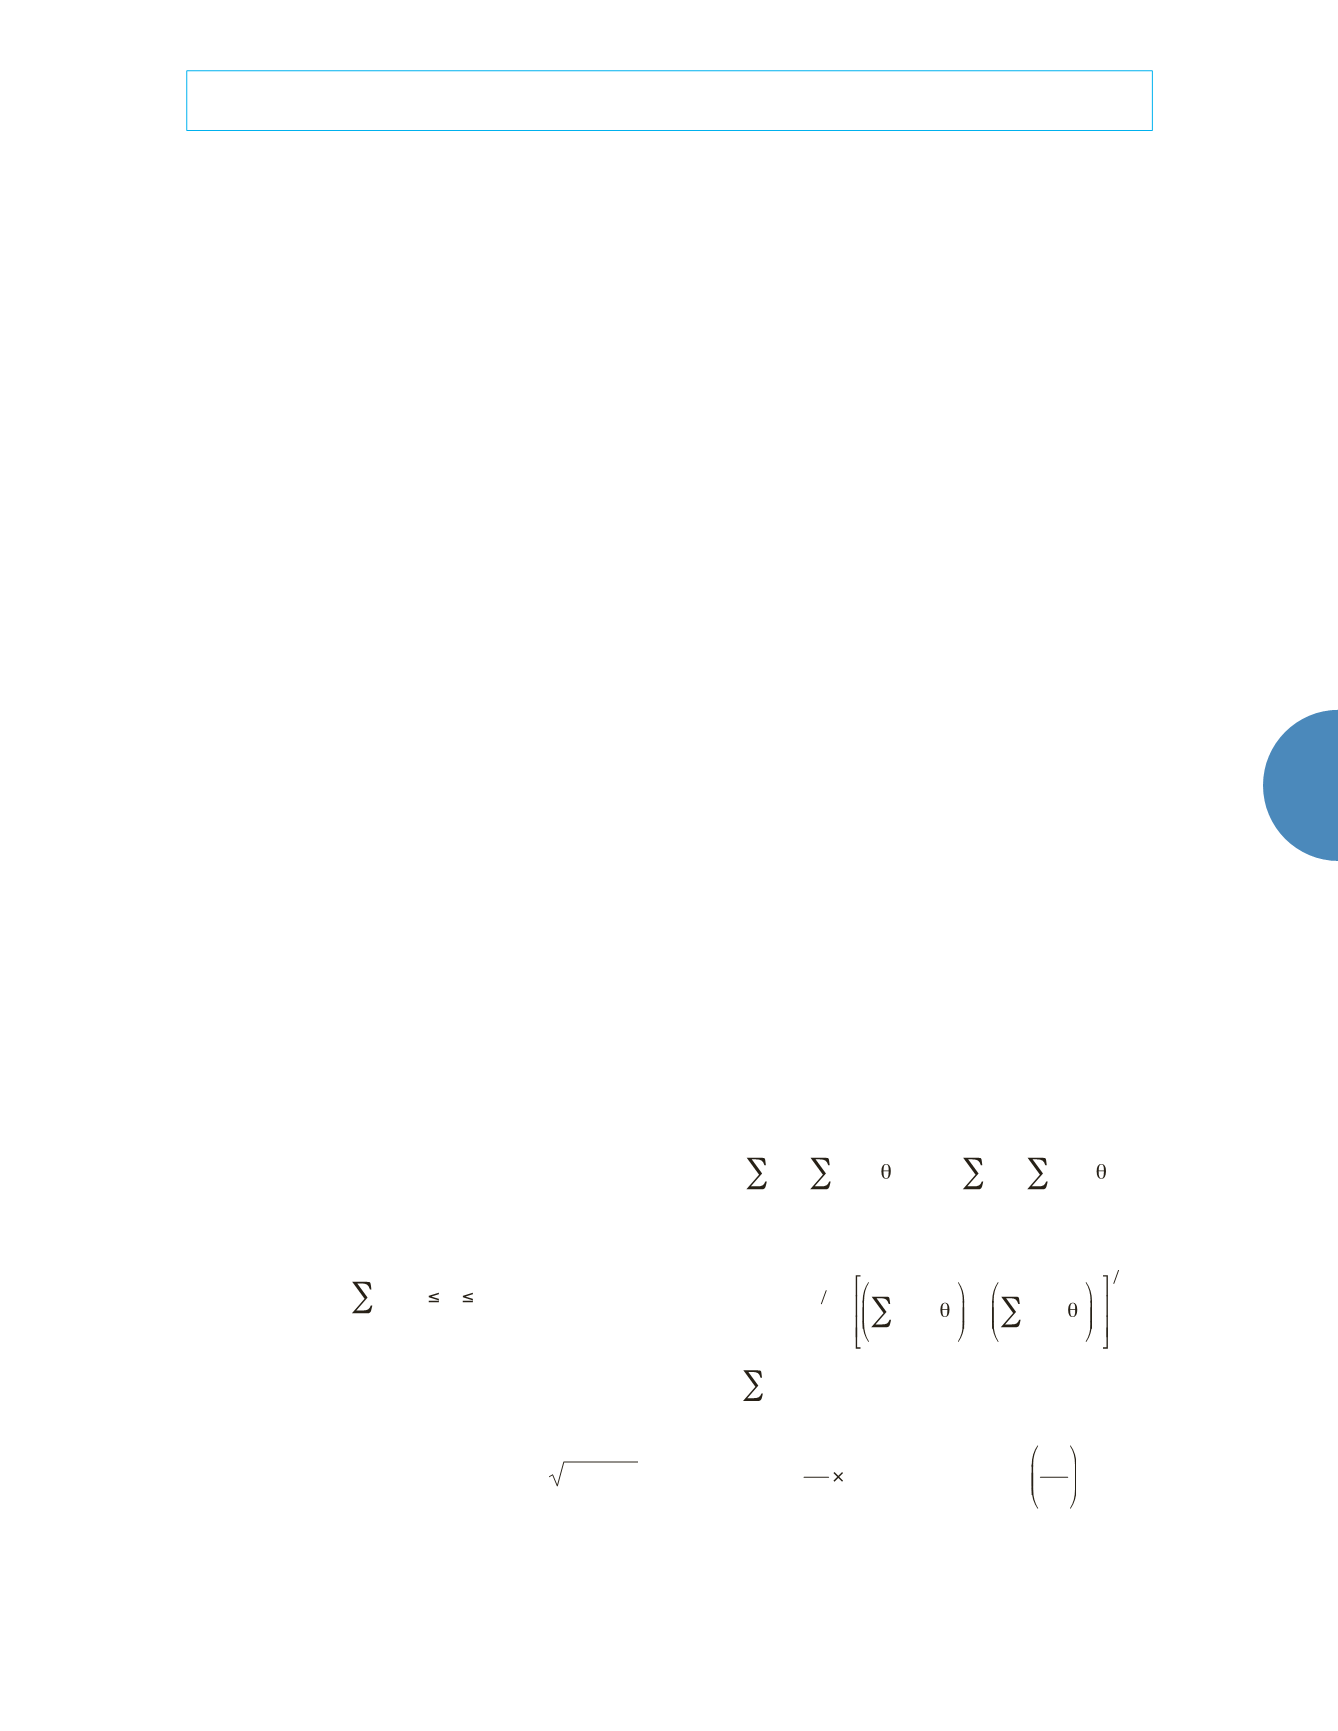
Set a monthly runoff for
r
i
(
I
= 1, 2, 3,.., 12).
The vector
r
i
is divided into horizontal and
vertical direction vector; horizontal vector
r
ix
=
r
i
cos
θ
i
; vertical vector
r
iy
=
r
i
sin
θ
i
; the vector
angle of the
i
monthly runoff is
θ
i
. Calculation
formula:
R
x
=
r
ix
i
=
1
12
=
r
i
i
=
1
12
cos
i
R
y
=
r
iy
i
=
1
12
=
r
i
i
=
1
12
sin
i
(2)
R
=
R
x
2
+
R
y
2
(
)
1 2
=
r
i
cos
i
i
=
1
12
2
+
r
i
sin
i
i
=
1
12
2 1 2
W
=
r
i
i
=
1
12
(3)
R
d
=
R
W
100%
R
p
=
arctan
R
y
R
x
(4)
R
stands for monthly runoff synthetic vec-
tor norm;
R
x
and
R
y
represent the horizontal


