85
Tecnología y Ciencias del Agua
, vol. VIII, núm. 2, marzo-abril de 2017, pp. 77-91
Mao
et al.
,
The runoff variation characteristics of Dongting Lake in China
ISSN 2007-2422
•
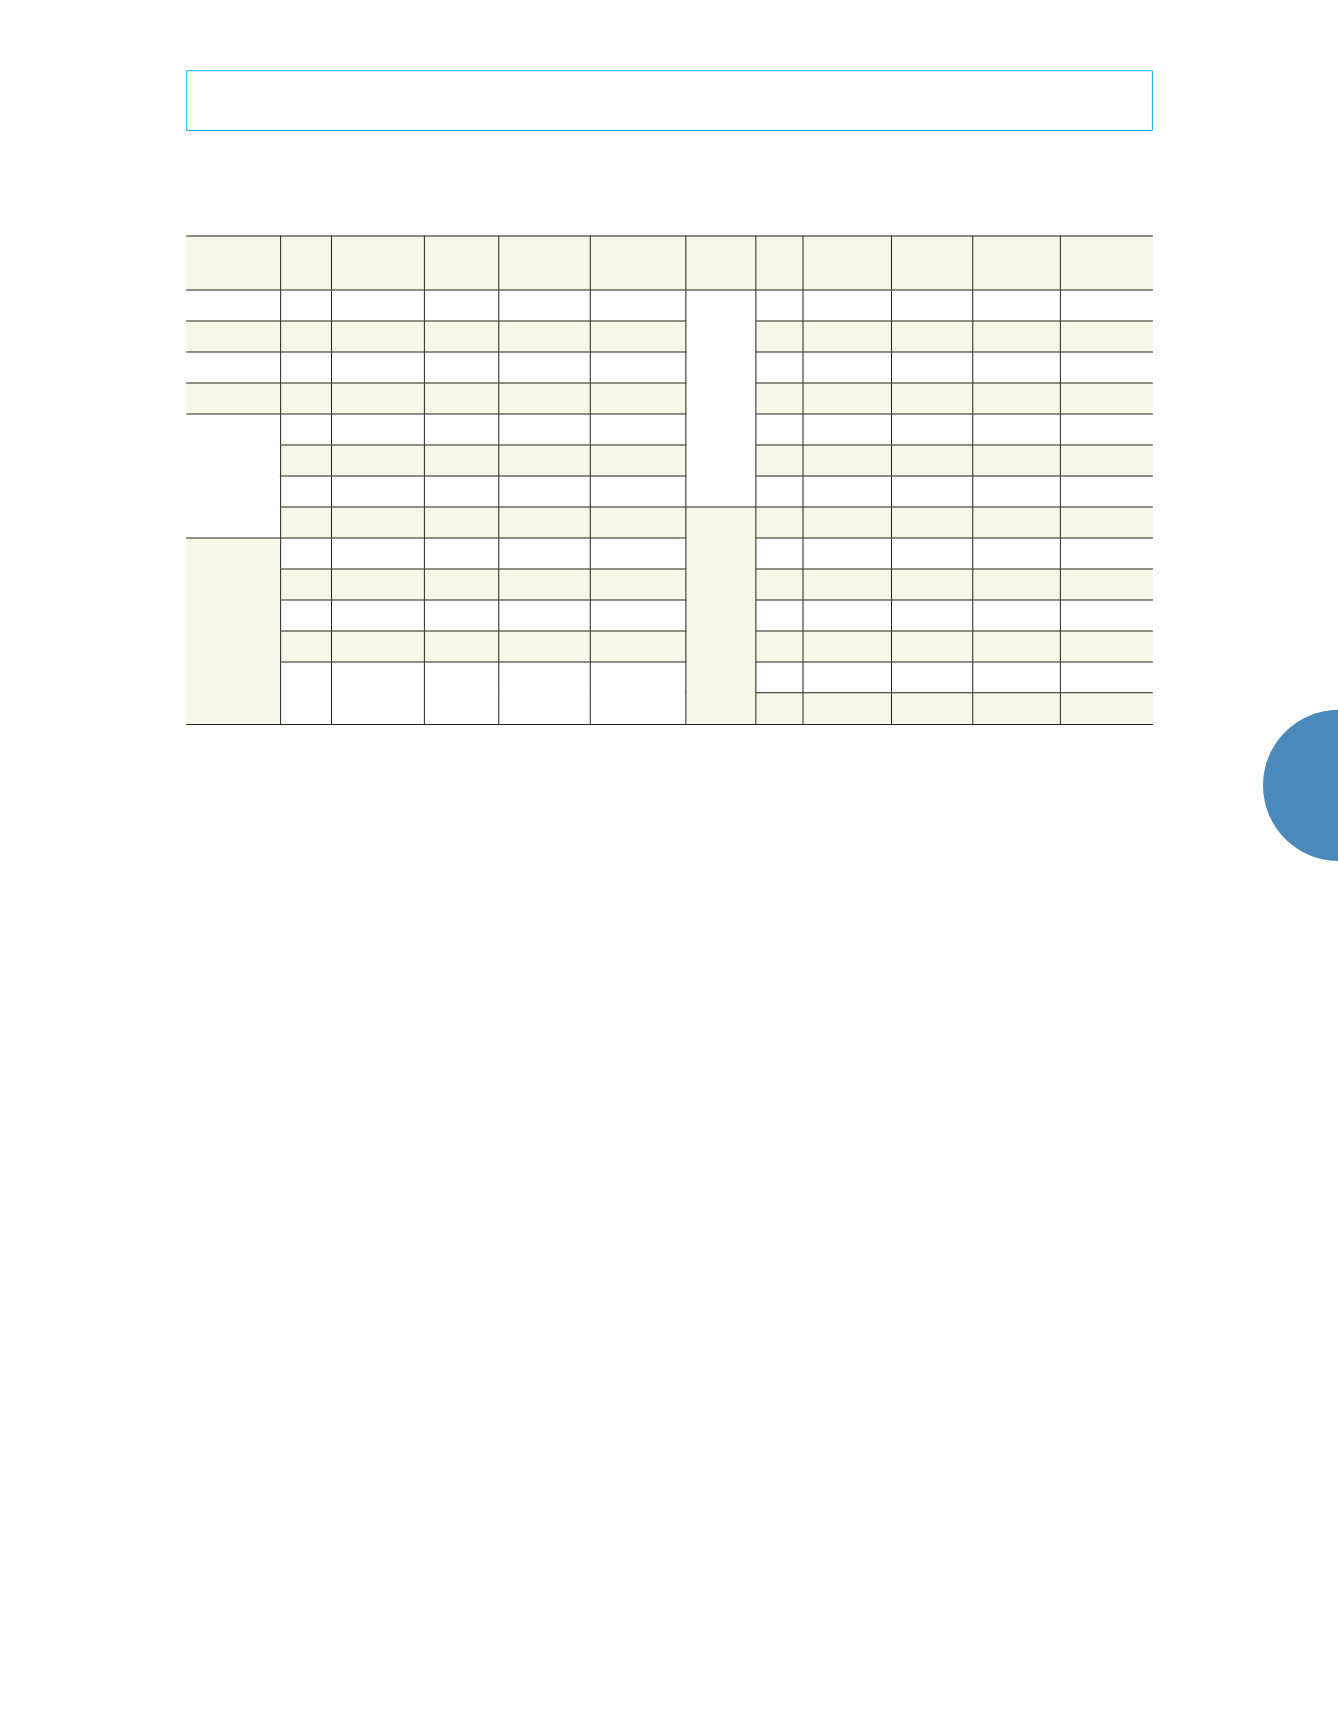
Table 3. Mean-difference T-test statistic of annual runoff of three outflows, four rivers, and Chenglingji.
Station
M
j
Mutation
index (
A
Ij
)
Statistic
(
t
)
Significant
level (
a
)
Thresholds
(
ta
)
Station
M
j
Mutation
index (
A
Ij
)
Statistic
(
t
)
Significant
level (
a
)
Thresholds
(
ta
)
Songzikou 35
0.847
6.533
0.01
2.704
Taoyuan
14
0.02
0.143
0.01
2.704
Taipingkou 35
1.015
7.660
0.01
2.704
16
0.02
-0.148
0.01
2.704
Ouchikou 25
1.372
10.156
0.01
2.704
26
0.115
0.893
0.01
2.704
Chenglingji
25
0.559
4.366
0.01
2.704
27
0.175
1.366
0.01
2.704
Xiangtan
5
0.242
1.032
0.01
2.704
30
0.15
1.165
0.01
2.704
30
0.085
-0.664
0.01
2.704
44
0.039
0.272
0.01
2.704
33
0.012
-0.096
0.01
2.704
55
0.498
2.180
0.01
2.704
38
0.127
-0.958
0.01
2.704
Shimen
27
0.104
0.799
0.01
2.704
Taojiang
5
0.525
2.571
0.01
2.704
37
0.099
0.750
0.01
2.704
12
0.052
0.366
0.01
2.704
42
0.078
0.559
0.01
2.704
17
0.050
-0.376
0.01
2.704
47
0.103
0.674
0.01
2.704
22
0.006
-0.047
0.01
2.704
49
0.201
1.211
0.01
2.704
28
0.001
0.012
0.01
2.704
53
0.346
1.576
0.01
2.704
57
0.195
0.649
0.01
2.704
Dry period and wet period of inter annual
runoff series
To identify wet period and dry period of
inter annual runoff series, this paper follow
the hydrology forecasting manual
established by
the information center of the water resources
ministry to define the runoff classification. The
annual runoff anomalies (in percentages)
K
i
is defined into 5 levels:
K
i
< -20% is dry year,
-20% ≤
K
i
< -10%is semidry year, -10% ≤
K
I
≤ 10%
is normal flow year, 10% <
K
i
≤ 20% is semi wet
year,
K
i
> 20%is wet year.
According to annual
K
i
of four rivers in
Hunan in figure 5 and table 4, we can find
that wet years alternate with dry years. The
percentage of normal flow year in Xiangtan,
Taojiang, Taoyuan and Shimen are 22.95, 40.98,
36.07 and 27.87%, respectively. From wet to dry,
percentages in each classification of Xiangtan
are 22.95, 11.48, 22.95, 18.03 and 4.59%. These
data listed above indicates a small inter annual
runoff change and relatively equal wet and dry
years in the last 61 years. The normal flow
percentage of Taojiang is 40.98% which means
very few floods and droughts in Zi River Basin.
Wet years, dry years and normal flow years are
of the same percentage in Shimen of Li river
basin. It suggests a great even of inter annual
runoff which is beneficial for the exploration of
water resources. On the other hand, four rivers’
normal flow year percentage is the maximum
followed by wet years’ and dry years’. Each
level does not last long. Therefore, the flow of
four rivers is neither wet nor dry sustainable. In
other words, the water allocation is relatively
average yields the likelihood of drought and
flood is small.
The statistical anomalies of three bayous’
runoff describe its variation characteristics
(figure 5, table 4). The portions of Songzikou’s
normal flow years, wet year and dry year ac-
counts for 32.79, 21.31 and 24.59% of the total.
That is a fairly large inter annual change. The
5 ratios from wet to dry of Taipingkou is 24.59,
9.84, 22.95, 18.03 and 24.59% which is evener.
In Ouchikou, the dry years account for 57.38%
of all while the wet years occupies 32.79%.The
dramatic inter annual water change is unfavor-
able for rational utilization of water resources.
Figure 5 displays the runoff characteristic of
three bayous. From 1951 to 1968, three bayous
sustained in a wet period. During the period
between 1969 and 1985, wet years alternated


