96
Tecnología y Ciencias del Agua
, vol. VIII, núm. 2, marzo-abril de 2017, pp. 93-103
Song & Song,
Kinetics and influential factors of nanoscale iron-facilitated nitrate-nitrogen removal
•
ISSN 2007-2422
abscissa and the nitrate removal efficiency was
used as the ordinate. The effects of the initial
nitrate nitrogen concentration on the removal
efficiency were investigated, as shown in figure
2. As shown in this figure, as the initial concen-
tration decreased, the removal rate increased
and the ratio of the final concentration to the
initial concentration decreased, with ratios
of 0.69, 0.67, and 0.64. The removal rate was
highest when the nitrate nitrogen concentra-
tion was 10 mg/l. In addition, the reaction rate
became constant after 30 minutes regardless
of the initial nitrate-nitrogen concentration.
The experimental results indicated that the
initial nitrate nitrogen concentration affected
the reaction rate, but not the removal rate. In
nanoscale iron-facilitated nitrate-nitrogen
removal, the nanoscale iron first absorbs the
nitrate nitrogen. Then, the nitrate nitrogen is
converted into nitrite nitrogen, ammonia, and
trace amounts of nitrogen via chemical reactions
on the surface of the nanoscale iron (Zhang, Jin,
Han, & Qin, 2006). The adsorption and response
capacities of nanoscale iron are constants. As a
result, the nanoscale iron content was relatively
excessive when the nitrate nitrogen concentra-
tion was low, resulting in complete adsorption
and conversion. Likewise, the nanoscale iron
content was relatively inadequate when the
nitrate nitrogen content was high, resulting in
incomplete absorption and conversion.
Influence of pH on the removal efficiency
Iron forms ions easily in acidic solutions and
combines with hydroxide ions to form precipi-
tates in alkaline solutions. Therefore, the effects
of pH on the nitrate-nitrogen removal efficiency
were also investigated. In the experiment, 0.5 g
of nanoscale iron was added to water containing
50 mg/l of nitrate nitrogen at a constant tem-
perature of 25 °C. Next, dilute HCl and NaOH
were used to adjust the pH of the solution to
values of 2.0, 4.0, 6.0, 7.0, 8.0, and 10.0. The ni-
trate nitrogen concentration was then measured
after different reaction times.
The results are shown in figure 3. As shown
in this figure, the ratio of the final nitrate
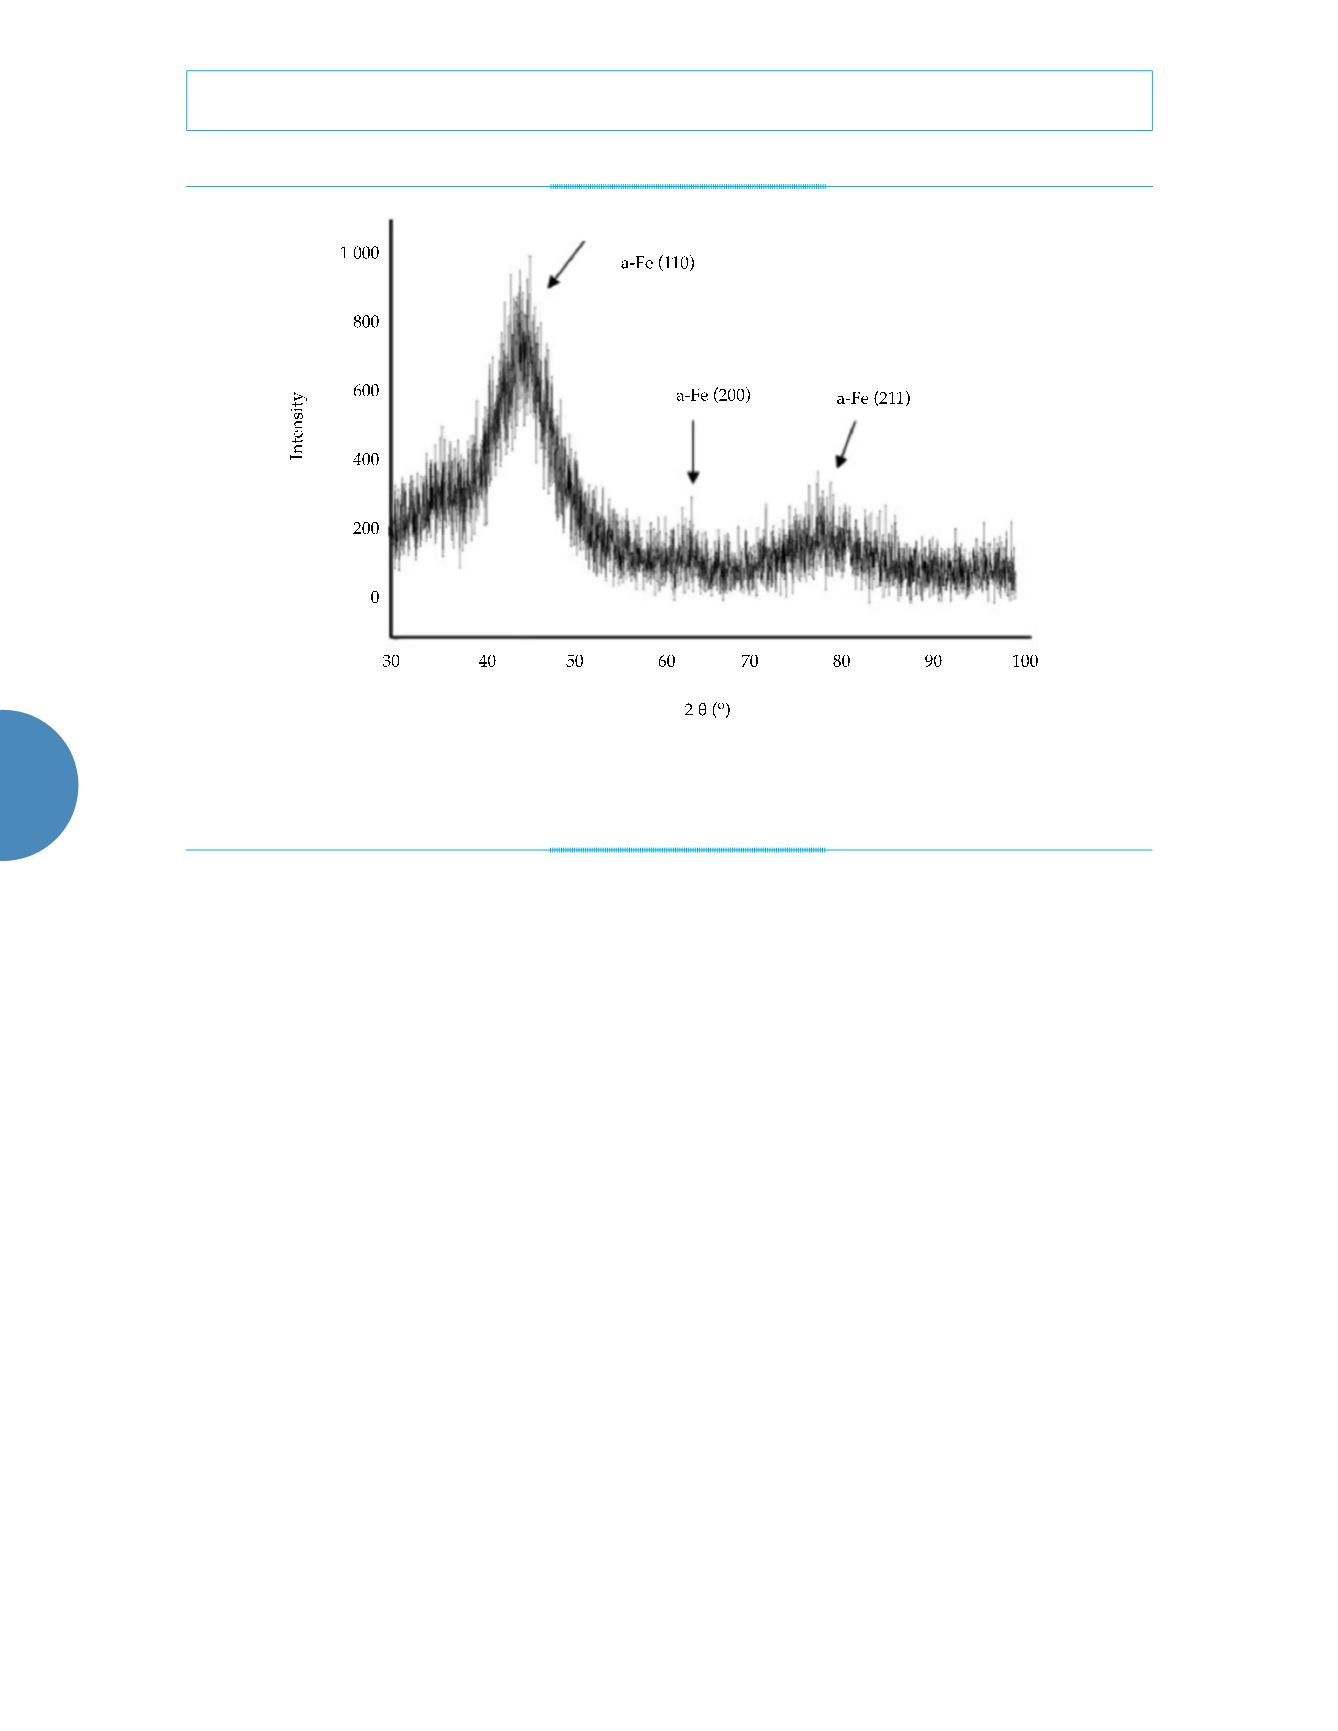
Figure 1. XRD spectrogram of the particle samples (the X-ray diffractometer was used to perform a phase analysis of the
nanometer particles with Cu as the target,
Ka
as the ray, and 100 mA as the current flow rate).


