111
Tecnología y Ciencias del Agua
, vol. VIII, núm. 2, marzo-abril de 2017, pp. 105-115
Wang
et al
.,
Research on the hydrologic cycle characteristics using stable isotopes of oxygen and hydrogen in the Jinxiuchuan Basin
ISSN 2007-2422
•
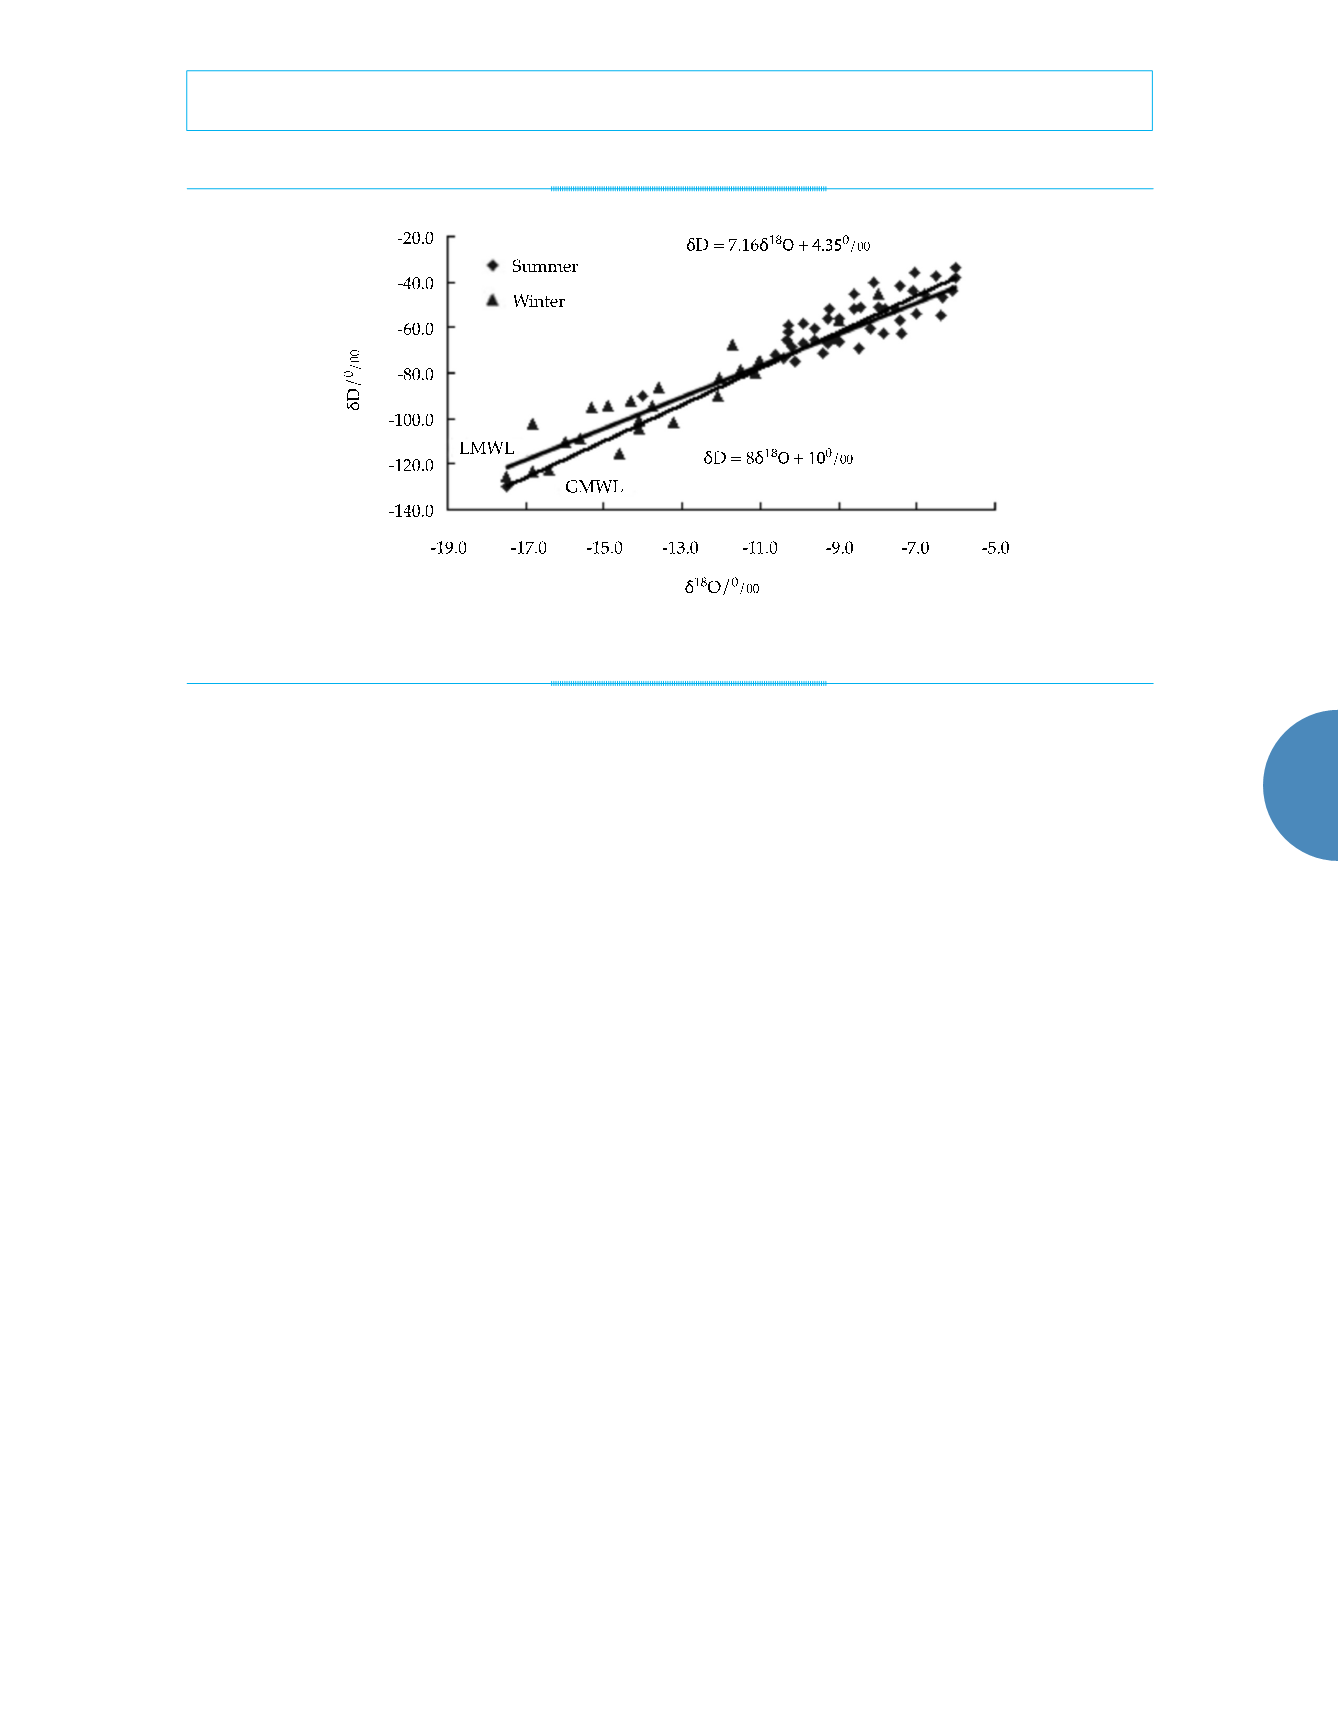
precipitation are mainly distributed in -90‰ ~
-30‰ and -11‰ ~ -5‰ in summer, respectively.
The variation ranges of
δ
D and
δ
18
O of precipita-
tion are -130‰ ~ -70‰ and -17.5‰ ~ -12.8‰ in
winter respectively, influenced by evaporation.
Most of the isotope values are higher in summer
than those in winter from the figure 4.
Deuterium excess analysis (
d
-excess)
Deuterium excess (
d
-excess), referred to as
d
value, is put forward by Dansgaard (1964),
the formula for
d
=
δ
D ‒ 8
δ
18
O. Different val-
ues reflect the disparate unbalanced degree of
evaporation and condensation process in the
region intuitively. It also shows the relationship
between d and evaporation rate in the region of
the moisture source. In other words, the higher
evaporation, the greater the value of
d
. It is actu-
ally an important comprehensive environmental
index of atmospheric precipitation (Wang,
Chen, & Wang, 2009). According to the linear
relationship between
d
values and isotopes, the
former is considerably affected by temperature,
humidity, rainfall and secondary evaporation
within the region. Generally, global average
d
value is 10‰. The process of the water cycle is
mainly affected by evaporation in one region,
and
d
value is greater than 10‰ in general.
In the study area, vapor sources of pre-
cipitation have different sources in summer
and winter due to the monsoon, which led to
higher
d
value in winter than summer. In ad-
dition, the
d
values of different sampling sites
along the direction of the clouds movement
are different. There is little precipitation at
Zhonggong and Liubu sampling sites, therefore
it is not discussed. The changes of
d
value at
Zhengjia, Jinxiuchuan Reservoir, and Ouchi
sampling sites from July 2011 to July 2012 are
shown in figure 5. The
d
values vary from 5.1 to
22.3‰ throughout the year. It ranges from 5.1
to 10‰ in summer (from June to September),
the average is 7.9‰, and the maximum is less
than 10‰. The results indicated that the area
is mainly controlled by marine air masses in
summer. However,
d
values are higher in winter
(from December to March), with the range 12.8
to 22.3‰, and an average of 14.0‰, which is
higher than summer. It showed that the
d
value
is mainly affected by polar air masses in winter.
Due to the monsoon climate, the ocean
warm air masses firstly move to the Jinxi-
uchuan Basin in summer, and then pass the
Ouchi sampling site located in the southeast.
The isotope data of Ouchi represent the initial
summer precipitation data, the
d
value of 5.1‰;
d
values tends to increase from southeastern
Figure 4. The relationship between
δ
D and
δ
18O in precipitation.


