120
Tecnología y Ciencias del Agua
, vol. VIII, núm. 2, marzo-abril de 2017, pp. 117-126
Wang
et al
.,
Simulation for non-point source pollution based on QUAL2E in the Jinghe River, Shaanxi Province, China
•
ISSN 2007-2422
where
c
is the average concentration of pol-
lutants in the section of river (mg/l);
Q
is the
average flow of the section (m
3
/s);
D
x
is the
longitudinal dispersion coefficient (m
2
/s);
A
is
cross-sectional area (m
2
);
S
α
is the source-sink
term;
x
is the distance between the monitoring
point and the pollution source (m), and
t
is the
time at the monitoring point (s).
If the flow (flux) is steady, then
=
0
Q
t
and
=
0
A
t
. Equation (1) then becomes:
c
t
=
A x D
x
A c
x
Qc
( )
A x
+
S
int
A
+
S
ext
A
(2)
where
S
int
is the internal source and sink of the
water quality variable (
i.e
., chemical reaction,
etc.) (kg/(s﹒m)), and
S
ext
is the external source
and sink (
i.e.
, branch impact, etc.) (kg/(s﹒m)).
To apply a steady model, the sections of the
river must be even, the hydrological condi-
tions should be stable, the current velocity and
the dispersion coefficient should not change
with time, and the source-sink term should be
constant, namely
=
0
c
t
. Equation (2) can be
simplified into:
D
x
2
c
x
2
u c
x k c
+
S
=
0
(3)
where
u
is the average current velocity through
the river section (m/s);
k
is the degradation
coefficient of the pollutant (1/d), and
S
is the
external source from the branch (mg/l﹒d).
As commonly occurs in non-tidal rivers,
more pollutants are removed by flow migration
than by the dispersion effect. Under steady state
conditions, the dispersion effect can be ignored,
and we obtain:
u c
x
=
k c
+
S
(4)
If the initial condition is:
x
= 0,
c
(
x
= 0) =
c
0
,
equation (4) is solved within the interval from
x
= 0 to
x = x
, and the analytical solution to the
one-dimensional water quality model is:
c
=
c
0
exp
k
u x
+
S
k
(5)
The diffuse source pollution between the
Jingcun and Zhangjiashan sections is ascribed to
the confluent pollutants introduced by the tribu-
taries in the wet season (including the discharge
from point sources in the dry season) and can be
obtained by subtracting the confluent pollutants
from the tributaries in the dry season from those
in the wet season.
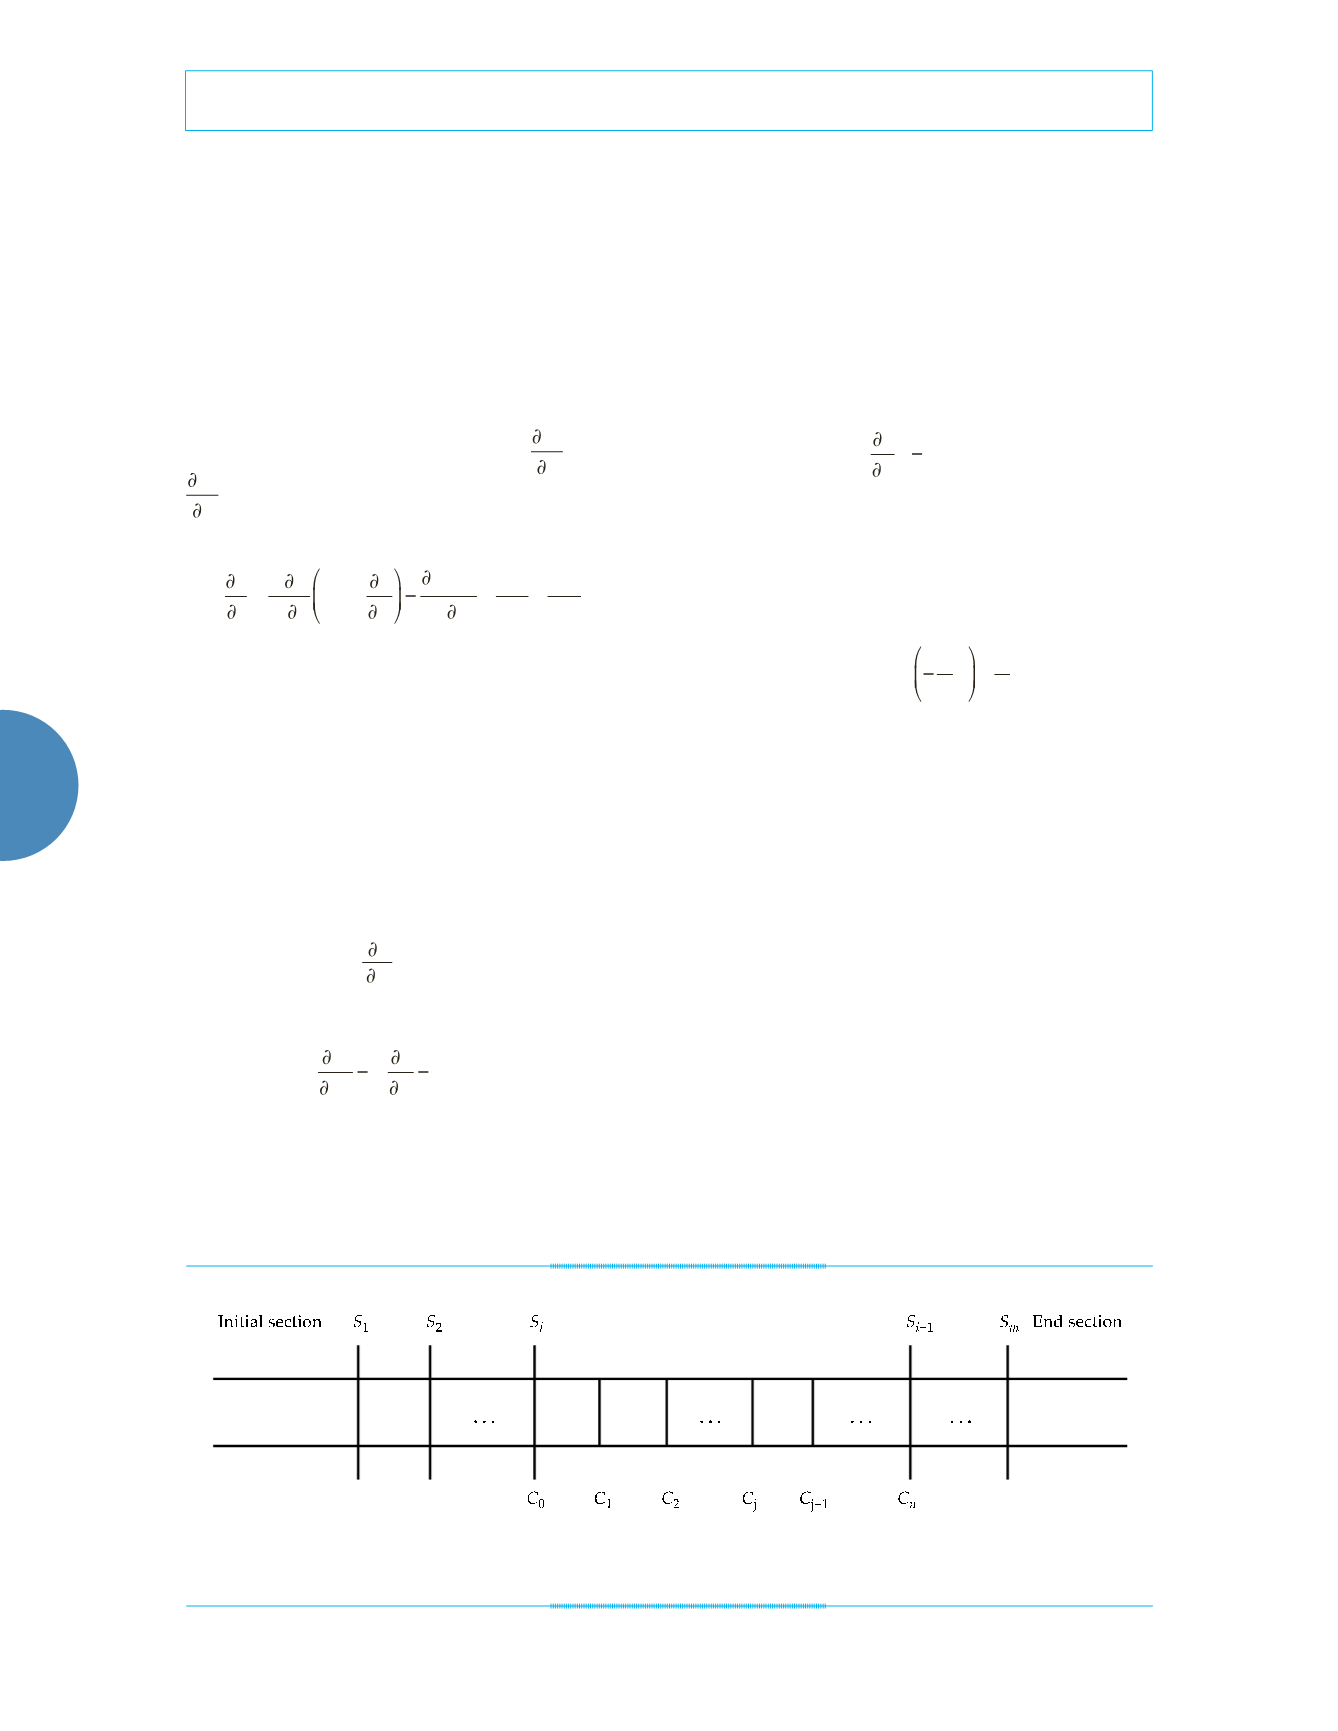
When the water quality model is applied, the
confluent pollutants from the branches between
the two sections are the source-sink term dis-
tributed evenly between the two sections. The
space between the two sections is subdivided
into several uniformly-spaced small cells to
improve the accuracy, as is shown in figure 2.
Figure 2. One-dimensional diagram of the river sections.


