45
Tecnología y Ciencias del Agua
, vol. VIII, núm. 2, marzo-abril de 2017, pp. 43-50
Luo
et al.
,
Phytoextraction potential of wetland plants for Copper in Water Bodies
ISSN 2007-2422
•
plant species and the Cu
2+
concen tration
process significantly affected the accumulation
of copper in plants. The analysis results were
showed in table 1.
Calamus and reeds showed very significant
differences at seven concentration processes
for the Cu
2+
accumulation capacity in different
emergent plants. The Cu
2+
accumulation content
in different plant species (calamus and reeds)
has significantly affected (
P
< 0.01). In addition,
the interaction of different Cu
2+
concentrations
and plant species also significantly affects
Cu
2+
enrichment capacity of wetland plants
(
P
< 0.01).
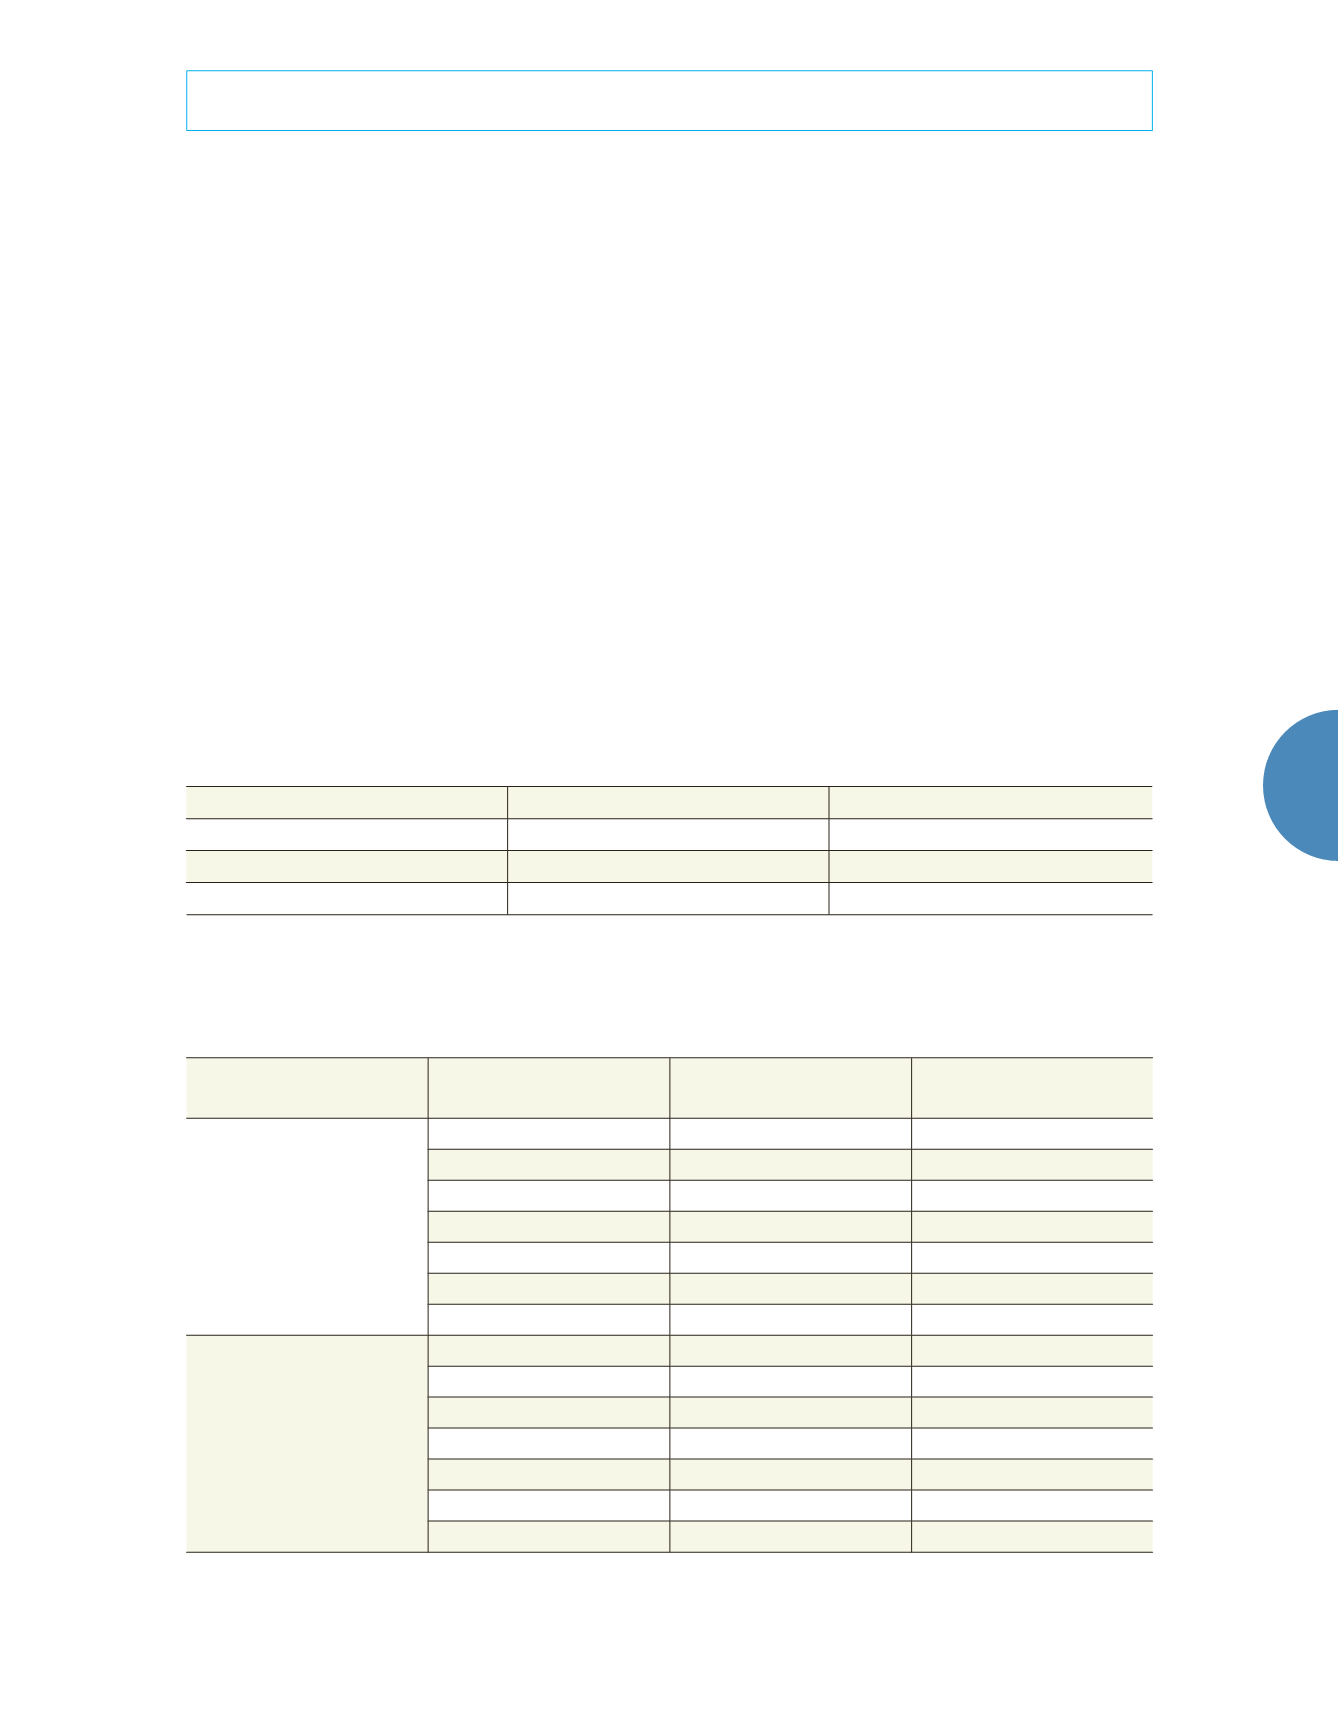
Table 2 shows Cu
2+
accumulation in
Acorus
calamus
and
Phragmites australis
.
Figure 1a and 1b indicated that the Cu
2+
accumulation contents in calamus and reed
showed significant differences. In general, Cu
2+
accumulation amounts in calamus were signifi-
cantly more than in the reed. The calamus has
a stronger ability to absorb and transport Cu
2+
than reed does.
The experiment results showed that the
Cu
2+
accumulation contents of calamus were
significantly more than that of reed in both
the above- and below-ground parts. The Cu
2+
enrichment amounts in the underground parts
of the two plant species were not significantly
different at low Cu
2+
concentrations (10 mg/l
and 25 mg/l). Yet, the Cu
2+
enrichment amounts
in calamus were significantly more than that
Table 1. The ANOVA analysis of Cu
2+
accumulation
F
P
Concentration process
33.13**
<0.001
Plant species
5.99*
0.0028
Interaction
5.60*
0.0038
* Notes: ** indicates a significant difference at p = 0.001; *indicates a significant difference at p = 0.01
Table 2. Cu
2+
accumulation in Acorus calamus and
Phragmites australis
.
Plant part
Cu
2+
concentration
(mg/l)
Acorus calamus
(mg/
kg)
Phragmites australis
(mg/kg)
Aboveground
0
7.4
a
122.79
b
10
115.09
a
159.92
b
25
681.23
a
143.61
b
60
899.17
a
223.69
b
100
4 107.53
a
198.39
b
200
6 208.5
a
264.75
b
500
4 206.9
a
349.73
b
Underground
0
37.85
a
113.17
b
10
282.73
a
236.54
b
25
955.3
a
768.41
b
60
2 980.97
a
373.75
b
100
8 107.53
a
429.22
b
200
4 271.03
a
379.52
b
500
2 198.27
a
448.83
b
* Notes: Values with different letters in the same element of the same species and same column indicate a significant difference at
p
= 0.05
according to the LSD test.


