134
Zhang
et al
.,
Improved online sequential extreme learning machine for simulation of daily reference evapotranspiration
Tecnología y Ciencias del Agua
, vol. VIII, núm. 2, marzo-abril de 2017, pp. 127-140
•
ISSN 2007-2422
also discovered that the Hargreaves method
provided better accuracy than other methods
among the empirical models.
Although IOS-ELM, ELM and LSSVMmod-
els had better simulation effects, the running
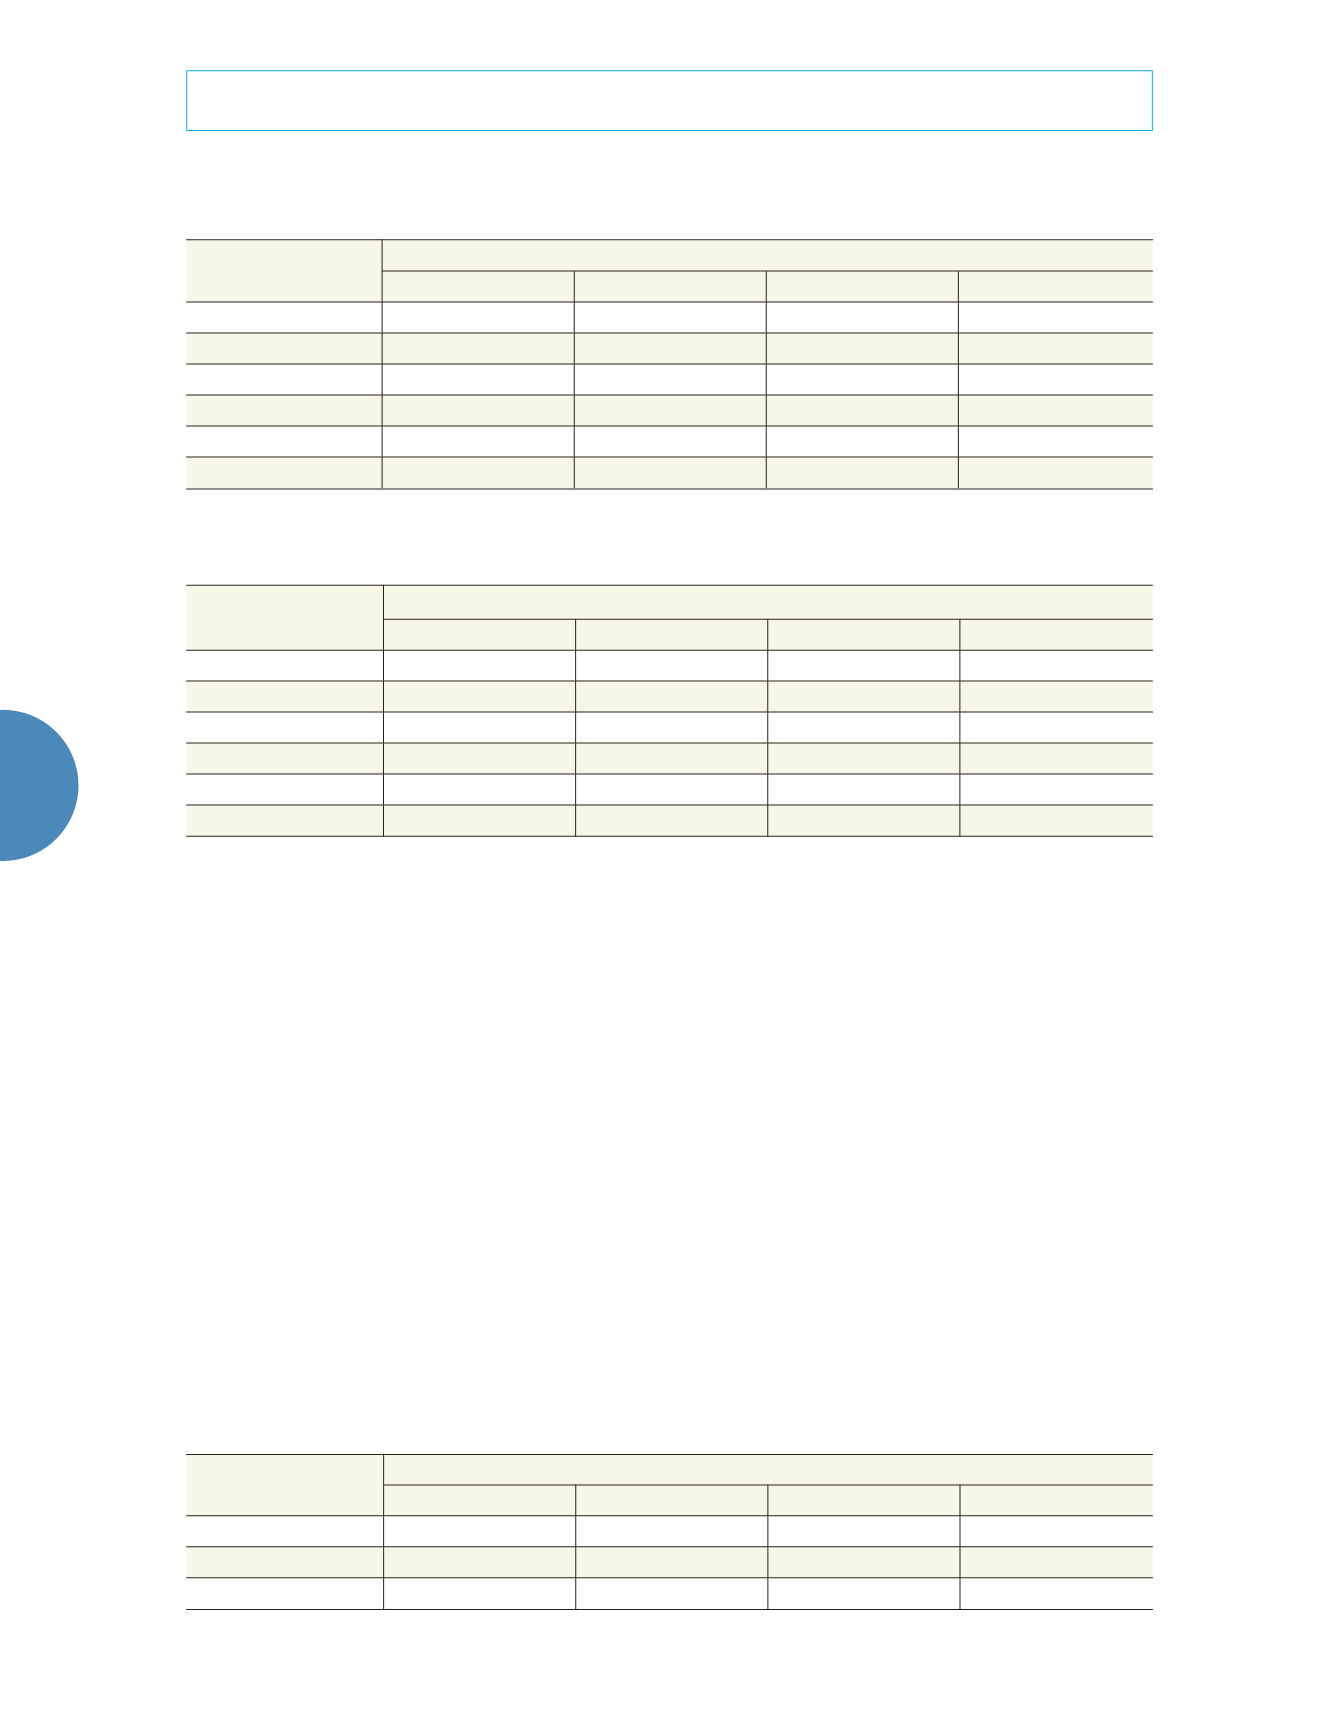
time is distinguishing, as shown in table 6.
It is clear from table 6 that the IOS-ELM
model runs faster than ELM and LSSVM in the
process of calculating by at least 24.8%.
In order to consider the portability and error
causes of the IOS - ELM model, the estimates of
each model for four cities are shown in figures
2-5 in the form of scatter plots in the validation
period. It is generally clear from the scatter
plots that the six input ISO-ELM estimates are
closer to the corresponding FAO-56 PM
ET
0
values than other models. The fit line equations
y
=
ax
+
b
and
R
2
values indicate that the ISO-
ELM model performed with better accuracy.
Meanwhile, the
a
and
b
coefficients of the six-
input ISO-ELM model were closer to 1 and 0,
respectively, with a higher
R
2
value than those
of the other models.
For Yulin, ISO-ELM and ELM estimates were
closer to the FAO-56 PM
ET
0 values than those
of the other models (
R
2
> 0.96). A slight differ-
ence exists between LSSVM, and Hargreaves
was better than the surplus models. The Mc
Cloud estimate had the least accuracy. It can
be concluded that the ISO-ELM and ELMmod-
els are the best methods to use for daily
ET
0
estimation in Yulin.
Table 4. RMSE of the models in the test period.
Models
RMSE (mm/day)
Yulin
A kang
Hanzhong
Xi’an
IOS-ELM
041
0.45
0.45
0.41
ELM
0.86
0.72
0.88
0.78
LSSVM
0.96
1.38
1.30
1.05
Hargreaves
2.18
1.38
1.27
0.79
Mc Cloud
3.53
2.20
1.98
1.70
Priestley-Taylor
2.43
1.73
1.59
0.71
Table 5. MAE of the models in the test period.
Models
MAE (mm/day)
Yulin
Ankang
Hanzhong
Xi’an
IOS-ELM
0.40
0.35
0.33
0.31
ELM
0.52
0.68
0.62
0.55
LSSVM
0.77
1.20
1.13
0.93
Hargreaves
1.97
1.25
1.19
0.58
Mc Cloud
3.15
1.86
1.66
1.36
Priestley-Taylor
2.13
1.56
1.40
0.51
Table 6. Running time of different models.
Model
Running time (
S
)
Yulin
Ankang
Hangzhong
Xi’an
IOS-ELM
16.5
17.9
13.8
17.1
ELM
28.8
23.8
21.2
25.8
LSSVM
22.4
30.5
19.9
36.5


