24
Tecnología y Ciencias del Agua
, vol. VIII, núm. 2, marzo-abril de 2017, pp. 19-30
Fan
et al
.
, Effect of drip irrigation with saline water on the shelterbelts to soil and groundwater environment in the hinterland of Taklimakan Desert, China
•
ISSN 2007-2422
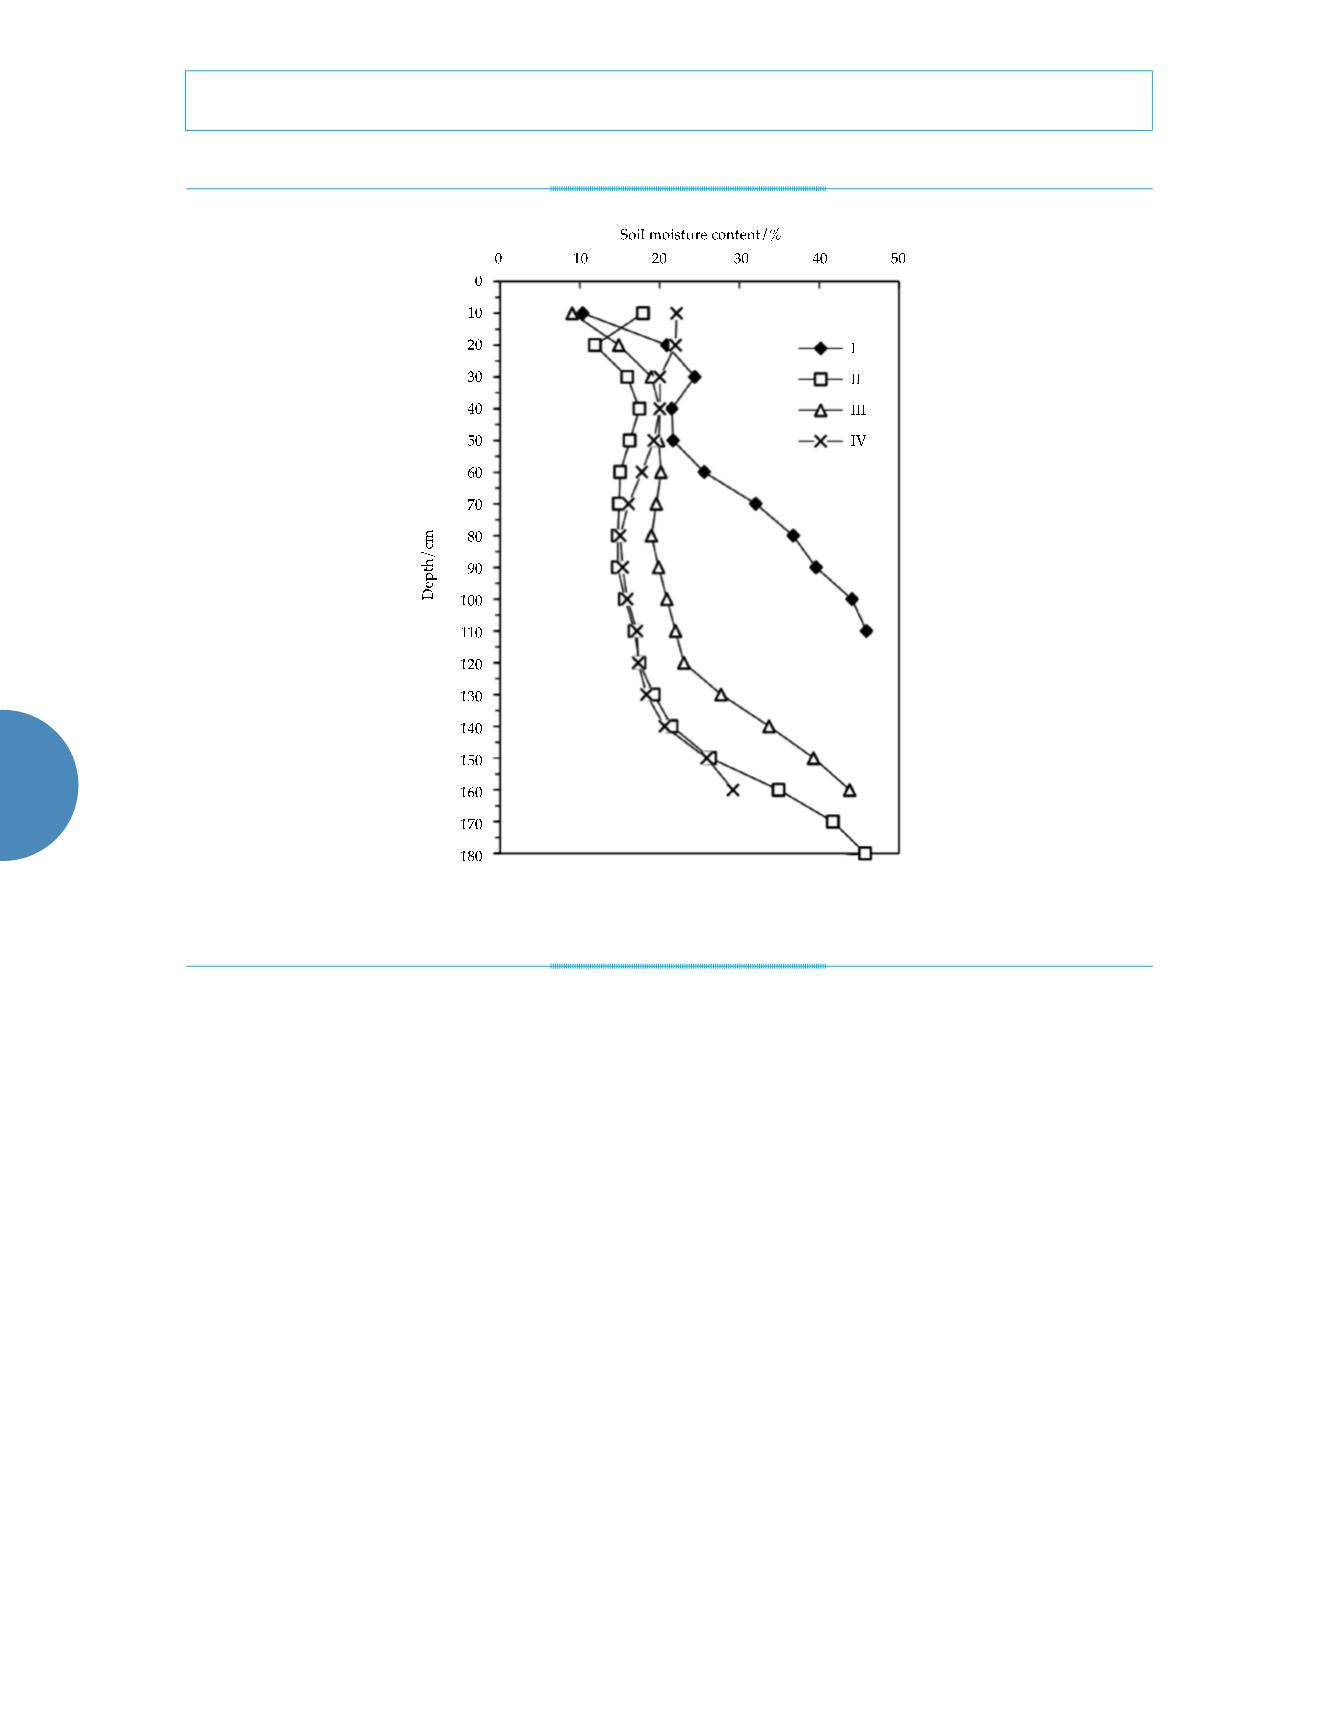
a depth of 100 cm, while the soil water content
in regions III, II, and IV reached saturation at
depths of 160, 180, and 160 cm, respectively.
Due to the shallow groundwater in the entire
irrigation area, an aquifer is present within 180
cm soil depth, while the groundwater depths of
four irrigated areas were different. The shallow-
est and the deepest groundwater depths were
found in regions I and IV, respectively, with a
gap of about 60 cm. Therefore, irrigation has a
relatively high impact on the surface soil water,
but a feeble one on deep soil water; the soil
water content of each region can be maintained
at a high level with the soil porosity of 45.55%.
Salt temporal change
Since shelterbelt plants have high tolerance to
soil salinity, plant could grow normally under
various irrigation systems, and soil salinity
increases from spring to autumn (Huang
et
al
., 2015). Due to multiple repeated irrigation
cycles, salts dissolved in irrigation water may
increase soil salinity, resulting in a salinity level
higher than that tolerated by the plant (Zhang
et al
., 2008), so understanding of the patterns
of the salt migration and accumulation is very
important. For example, the pattern in salt mi-
gration of region I was studied by continuous
salinity monitoring within the irrigation cycle.
As shown in figure 3(b), 3d after irrigation, the
total soil salinity was significantly reduced, as
compared to that in figure 3(a) and there was
no significant salt accumulation. Most of the
salt was infiltrated with the soil water from the
range defined by the dashed line in figure 3(a)
(
i.e.
the range from the surface to 20 cm) through
the vadose zone into groundwater body. As
can be seen from figure 3(c), over the course of
evaporation and water redistribution, the salt
Figure 2. Differences in the soil water content under different irrigation treatments.


