22
Tecnología y Ciencias del Agua
, vol. VIII, núm. 2, marzo-abril de 2017, pp. 19-30
Fan
et al
.
, Effect of drip irrigation with saline water on the shelterbelts to soil and groundwater environment in the hinterland of Taklimakan Desert, China
•
ISSN 2007-2422
Here the number of days with irrigation is
240 from March to October. The water volume
that drips out of emitters is 3.5 × 10
-3
m
3
per
hour. The control area of the drip water emitter
is 1 m
2
. The single irrigation time is 6 hours per
emitter.
W
IP
is
irrigation period/interval,
W
IP_1,
W
IP_2,
W
IP_3
are March to May, June to August,
and September to October irrigation periods,
respectively;
n
is
II
,
III
,
IV
.
Measurement and analysis
The effect that saline water irrigation to the
groundwater was observed by four wells from
the emitter every 30 cm called 1, 2, 3, 4, and set
a control check (CK) observation well in bare
sandy land around 100 meters away (figure 1). It
reflected cumulative-change values by subtract-
ing groundwater level and chemical indicators
(TDS, pH, total alkalinity & total hardness)
before the irrigation from the corresponding
value after irrigation, where TDS were tested by
using the 180 ºC drying weight method (APHA-
AWWA-WEF, 1998). Measurement of pH was
performed using a pH meter (Model PHS-3C,
Shanghai Lici Ltd., China). Total alkalinity was
determined by titration with acid (Larocque
et
al
., 2016). Total hardness was determined by an
EDTA complexometry.
The effect of the irrigation to the groundwa-
ter level was observed every day in an irrigation
period 12d. It measured by releasing a probe
connected with a multimeter by dual-cable
wire into the well pipe. The multimeter was
switched to the resistance shift. When the probe
touched the water table, the cable was marked
at the height of the well head, and the distance
between the mark and the probe was measured
after retrieval. The subtraction of the
n
th water
table observation H
n
data from the initial obser-
vation data H
0
gave the relative water level at
the
n
th observation (H
0
−H
n
) to each observation
wells.
Seedling investigation method was used
for shelterbelts trees during the whole growing
season, ten representative plants were randomly
selected by human from
Tamarixramosissima
and
Haloxylonammodendron
respectively, and three
indicators of plant height, crown width, and
diameter at the ground level were measured.
The One-Way ANOVA and least significant dif-
ference (LSD) method were used to analyze the
influence of irrigation water for plant growth
using SAS statistical software (version 9.1, SAS
Institute Inc.).
Regular on-site investigation method was
adopted to observe the soil salt in the experi-
ment area on 1d, 6d, and 9d after irrigation.
Soil electrical conductivity (EC) exhibiting a
linear relationship with soil salinity within
the study area (Wang, Xu, Lei, Li, & Wang,
2010), the respective EC value was measured,
in order to assess the soil salinity, by a SY-3
conductivity-thermometer (Institute of Soil
Science, Chinese Academy of Sciences, 1987)
with the weight of water: soil = 5:1 (Han, Cao,
Yimit, Xu, & Zhang, 2012). The soil samples
were collected at depths of 0, 5, 15, 25, 35,
55, 75 and 95 cm under the emitter with the
horizontal distances of 0 to 150 cm every 30
cm from the emitter. Three samples per each
fixed point were used to measure EC.
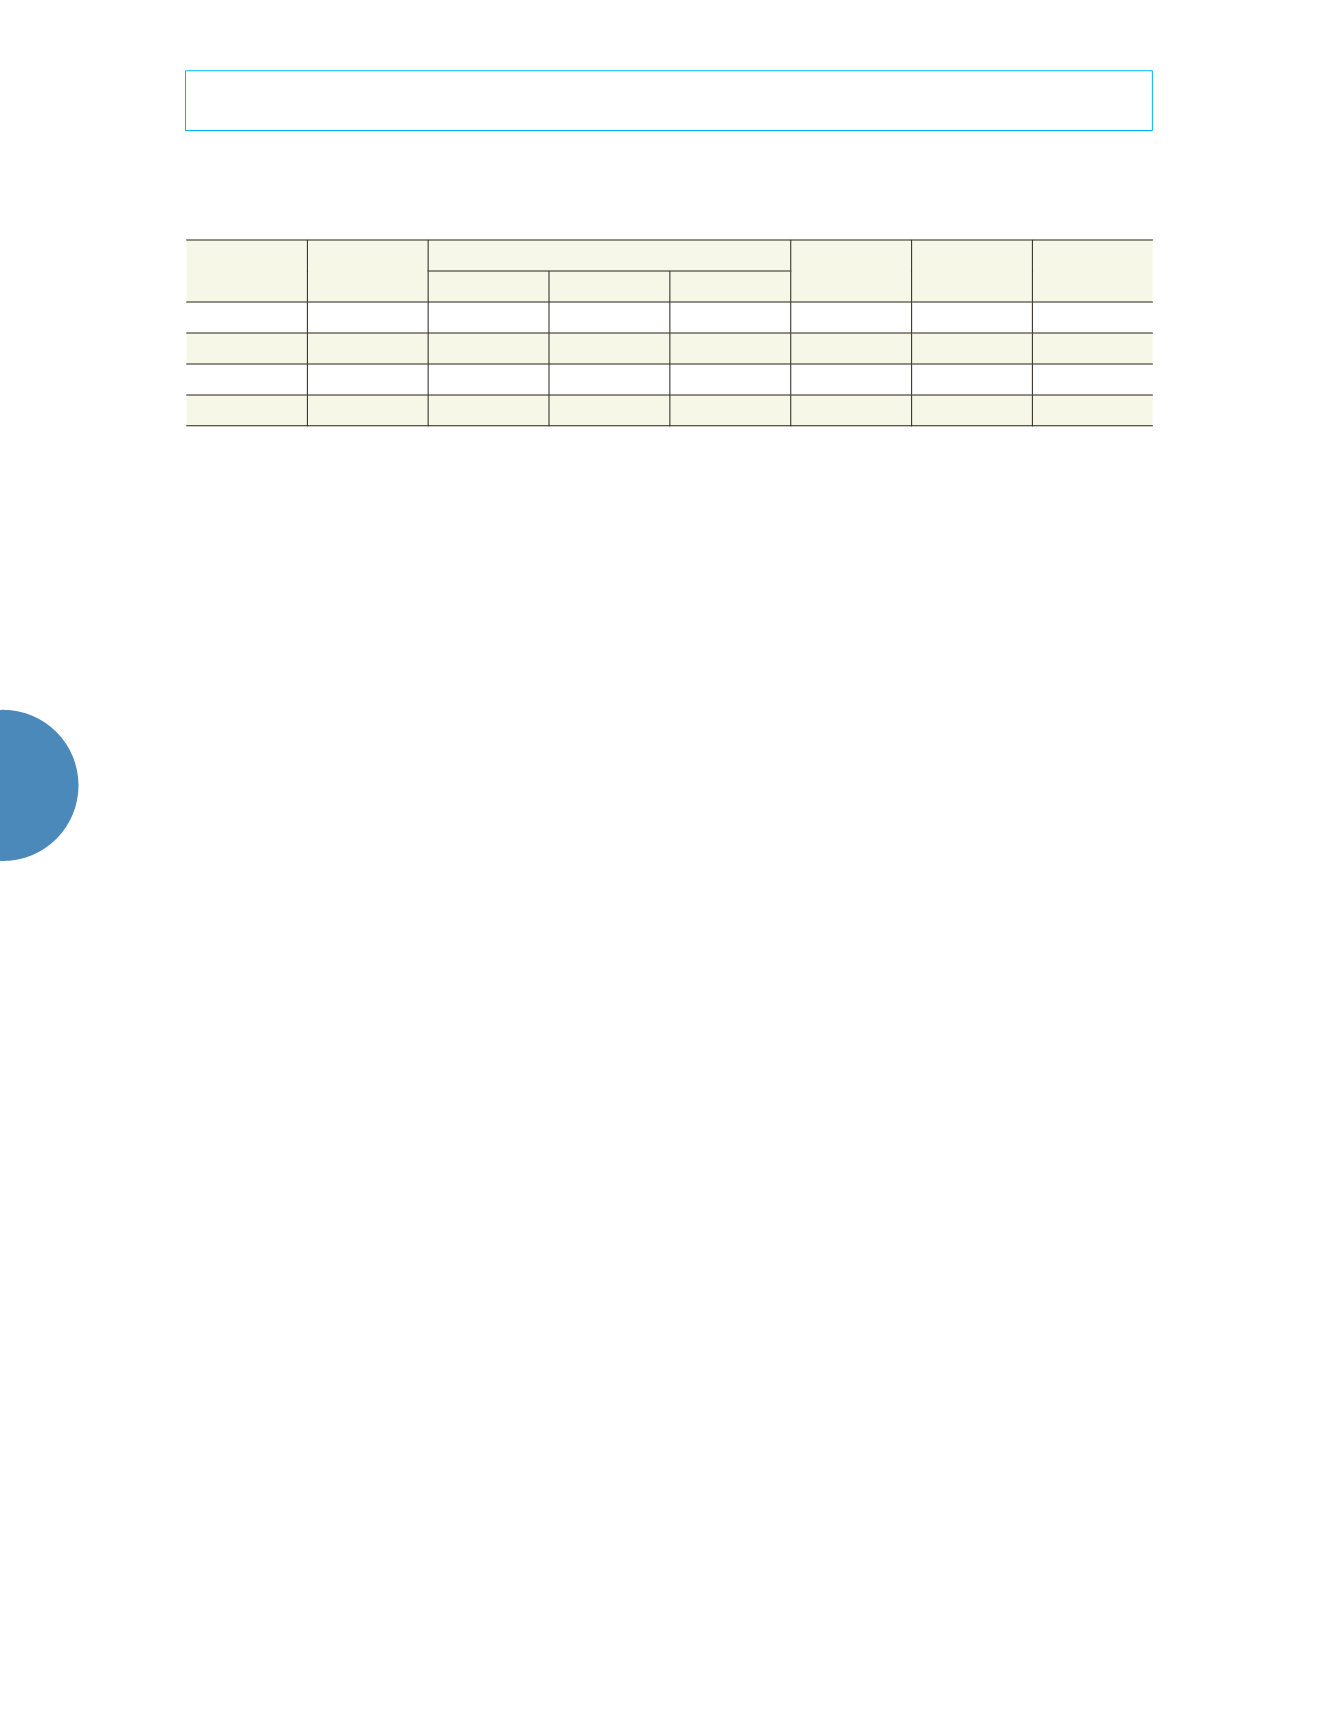
Table 1. Experimental design for different irrigation treatments.
Irrigation
treatment
Irrigation
time/h
Irrigation period/d
W
IT
W
IW
/mm
W
CR
/%
Mar.- May.
Jun. - Aug.
Sep.- Oct.
I
6
12
12
12
20
420.0
-
II
6
15
25
15
13.6
285.6
32.0
III
6
20
25
20
11.1
233.1
44.5
IV
6
25
25
25
9.6
201.6
52.0


