156
Wei
et al
.,
Water table response to a pumping test in the hinterland core area of the Taklimakan Desert, China
Tecnología y Ciencias del Agua
, vol. VIII, núm. 2, marzo-abril de 2017, pp. 151-158
•
ISSN 2007-2422
level fluctuation. If these effects are taken into
consideration for correction, we can determine
a more accurate water level correction.
The upper graph is the observation water
depth of whole year, and the inferior graph is
the depth during the pumping test.
Hydrogeological parameters
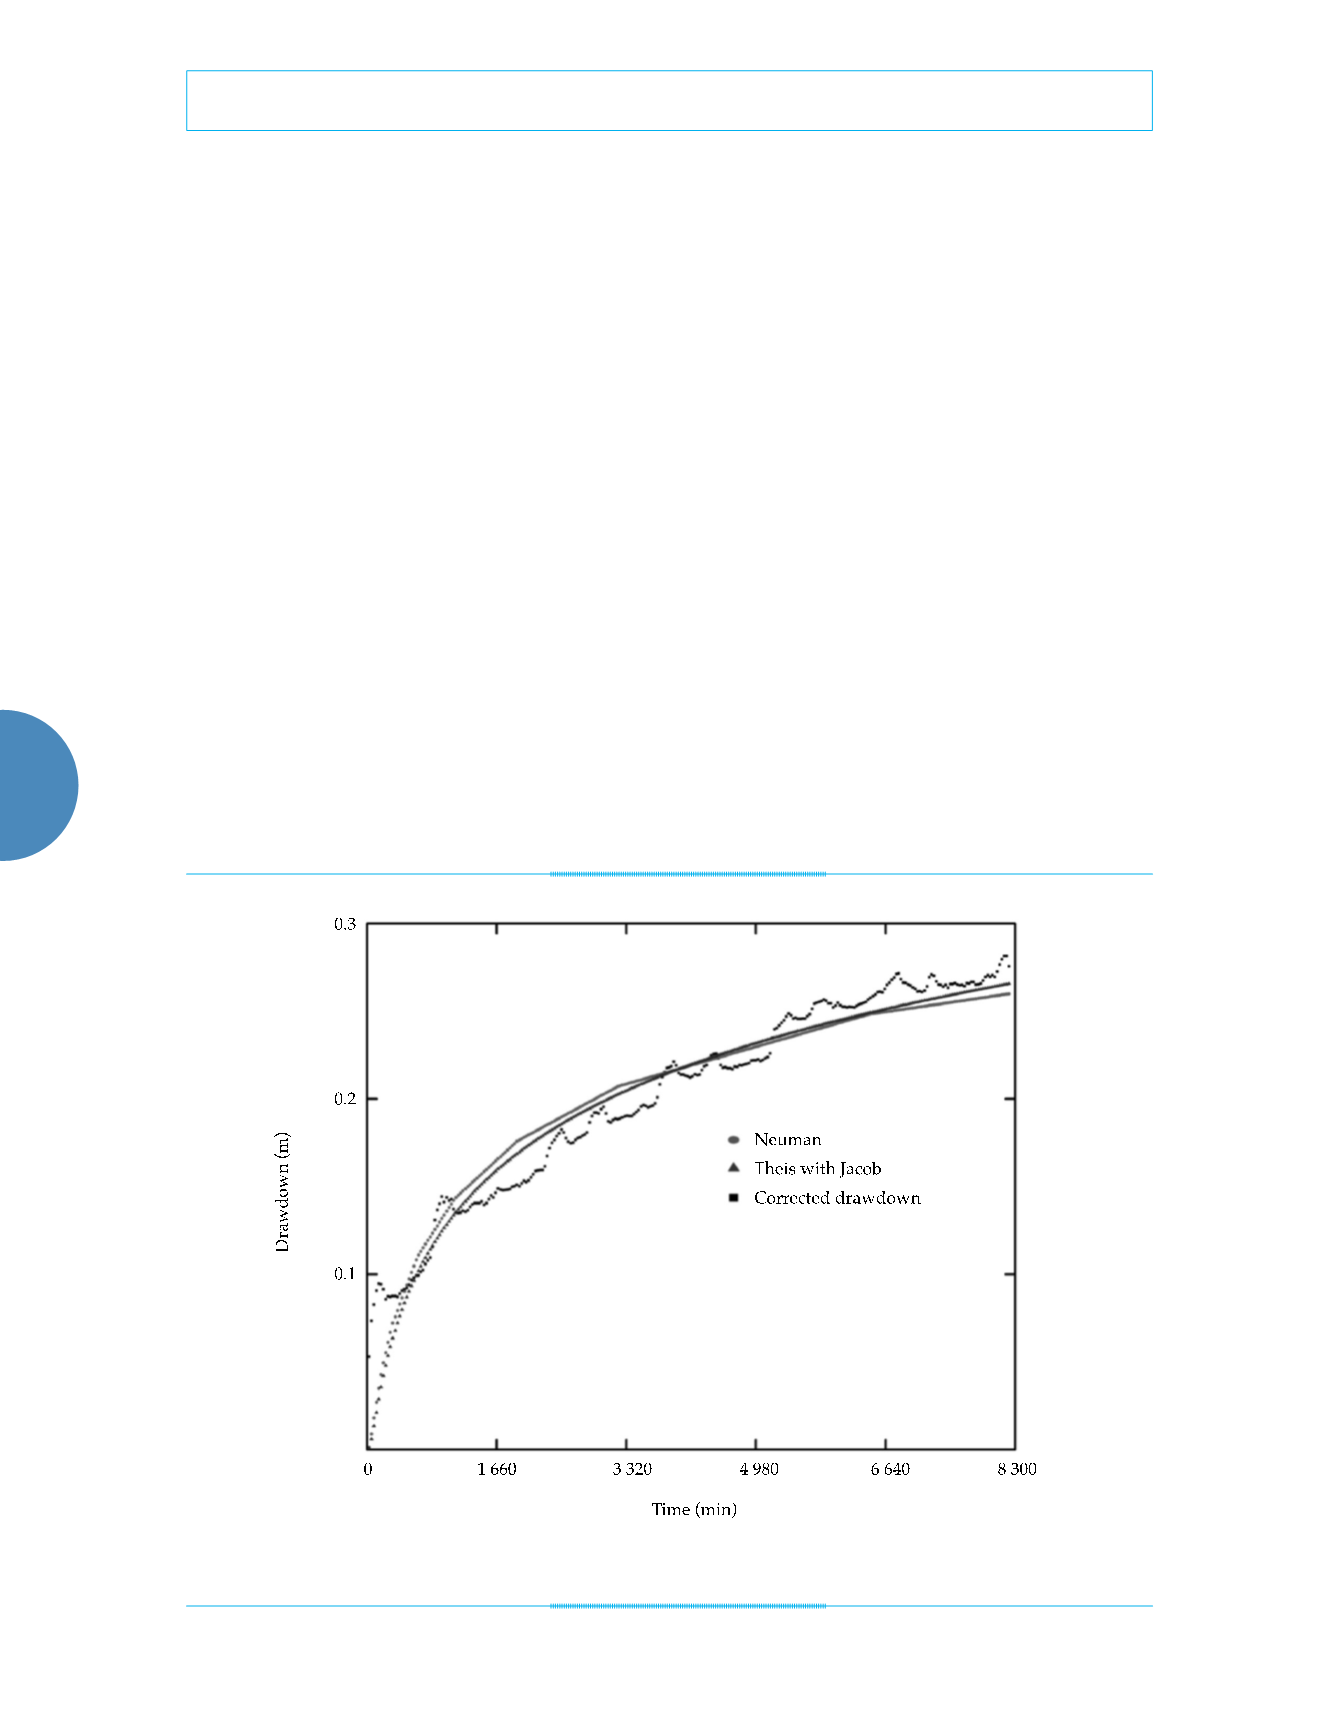
The Boulton model does not achieve fitting
results. The remaining two models are more
successful and achieve the results shown in
figure 4.
Through curve fitting, the hydrogeological
parameters of the Theis model with the Jacob
correction are as follows:
T
=
8.96
E
2(unit:m
2
/
d
)
(6)
S
=
6.11
E
– 2
(7)
And the hydrogeological parameters of the
Neuman model are as follows:
T
=
8.76
E
2(unit:m
2
/
d
)
(8)
S
y
= 5.00
E
– 1,
K
v
/
K
H
= 1.12
E
– 3,
S
y
/
S
= 1.00
E
1 (9)
The permeability coefficient of the two mod-
els calculated is 13.6 m/d and 13.3 m/d, which
is good agreement with previous
K
= 12.85 m/d
(Fan
et al
., 2010) and
K
= 13.32 m/d (Fan, Jin,
Lei, Xu, & Zhou, 2013). These hydrogeologi-
cal parameters are calculated using the water
level process curve model fitting based on the
pumping test, and the results are useful for the
construction of the hydrological model.
Conclusions
In this paper, for the unsteady flow pumping
test in an unconfined aquifer, three kinds of
Figure 4. Groundwater level fitting of the Theis with Jacob correction and Neuman Models during pumping.


