56
Tecnología y Ciencias del Agua
, vol. VIII, núm. 2, marzo-abril de 2017, pp. 51-60
Kan
et al.
,
Daily streamflow simulation based on improved machine learning method
•
ISSN 2007-2422
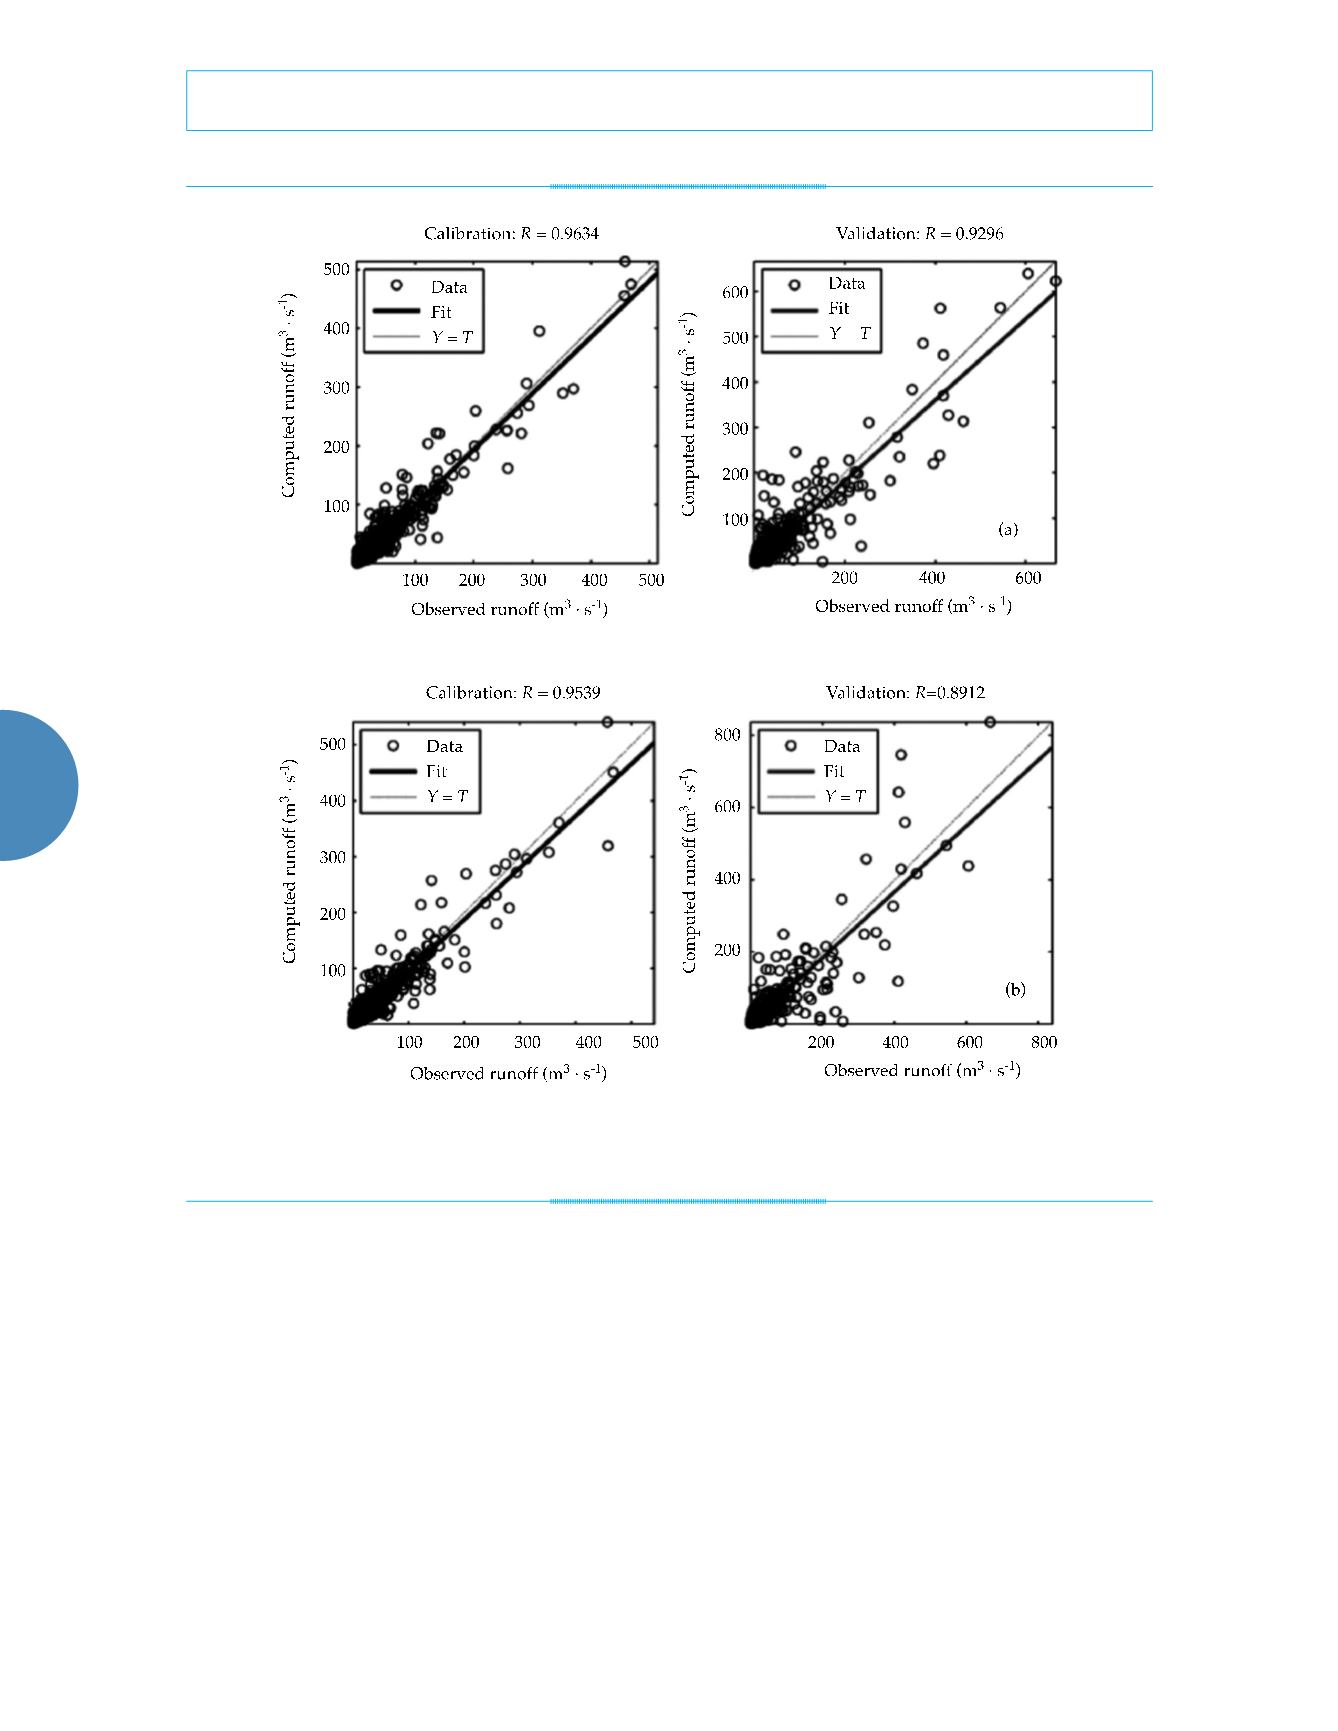
results than the original NU-PEK model. As
demonstrated in figure 2, for peak values, the
PKEK model is much better than the NU-PEK
model. The comparison results indicate that the
PKEK model outperforms the NU-PEK model in
Chengcun catchment and prove its satisfactory
accuracy and stability.
Simulated hydrographs comparison
Figures 3 and 4 show the observed and simulat-
ed hydrographs in the calibration and validation
period of the PKEK and NU-PEK models, re-
spectively. Due to the space limitation, we only
demonstrate two hydrographs for each model.
They are year 1986 for calibration and year
1995 for validation, respectively. As shown in
these figures, a further ascendency of the PKEK
model is that the hydrographs simulated by the
PKEK model are much smoother. The hydro-
graphs simulated by the PKEK model are more
consistent with the observed hydrographs. The
improvement in hydrograph shape is owe to the
inclusion of the SADs and is attributed to the
Figure 2. The scatter plots of the observed and simulated discharges and the regression
R
values: (A) PKEK model,
(B) NU-PEK model.


