112
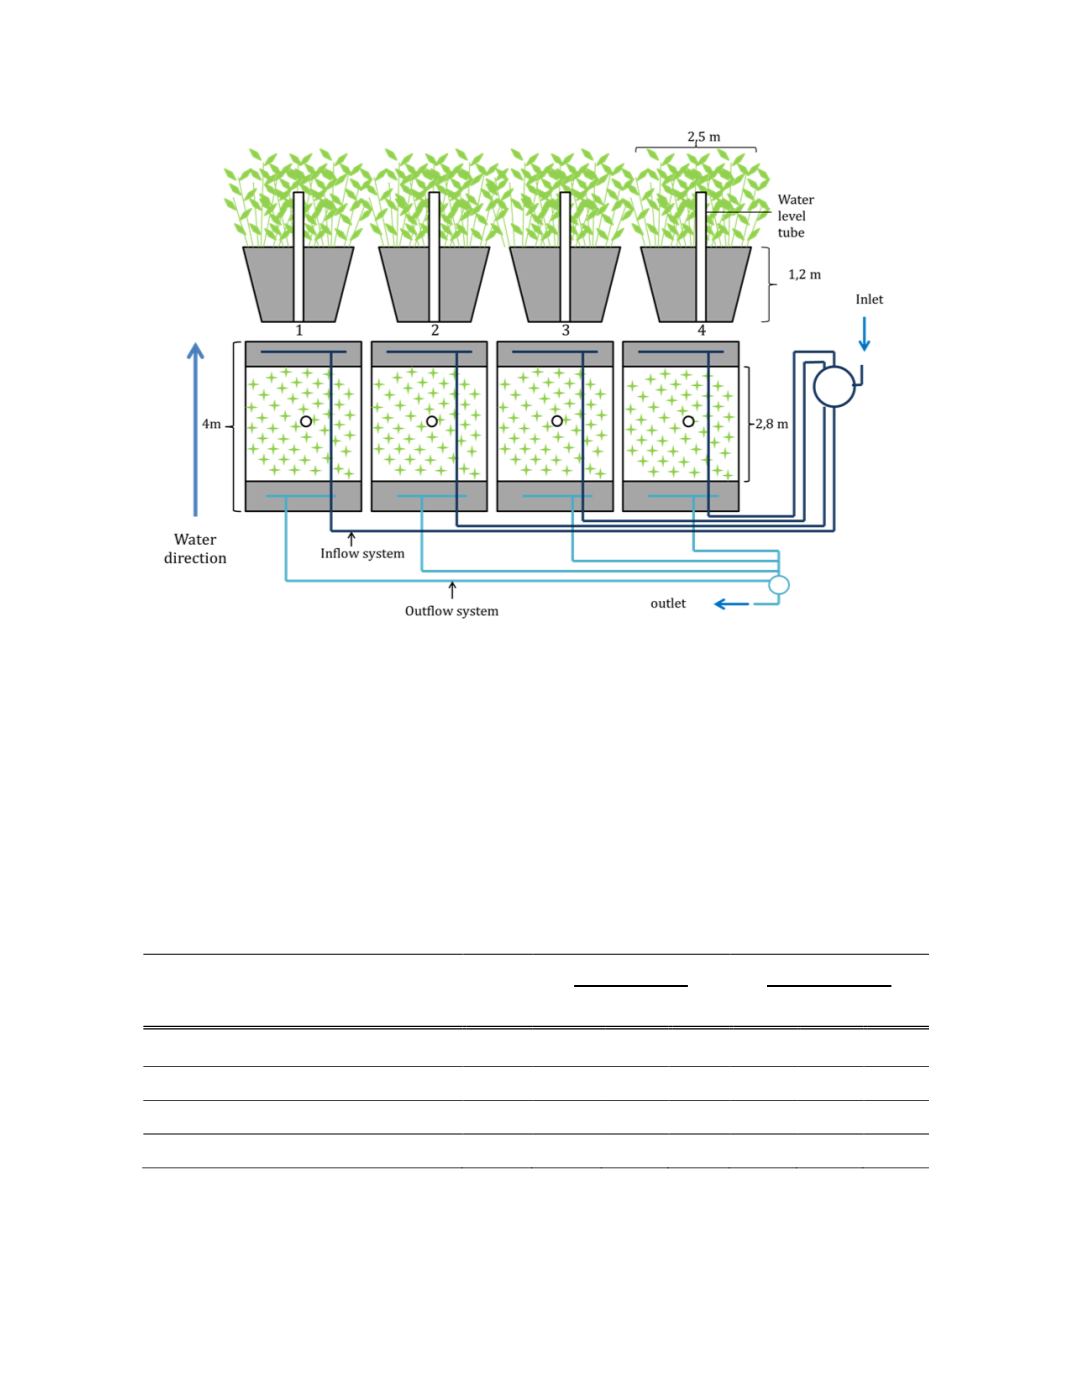
Figure 1: pilot scale constructed wetlands set up. Legend: 1) Typha angustifolia, 2)
Phragmites australis australis, 3) Phalaris arundinacea, 4) Phragmites autralis americanus
Because the constructed wetlands were fed with a real leachate originating from the pole
yard, the concentration of the influent varied depending on rainfall and temperature (Chang
et al.
2013).
To observe the effect of the concentration on plant growth and plant capacity for
biosorption, a pot experiment was carried out for 10 weeks (from the July 8
th
to September
16
th
2013). In the pot experiment, the four macrophytes species tested were exposed to three
different concentrations of polluted water (Table 1) and a control (tap water). After week 5,
half of the plants were collected and the contaminated water was renewed.
Table 1: Concentration of the contaminated water in the pot experiment
Weeks 1 to 5
Weeks 6 to 10
units
C1
C2
C3
C1
C2
C3
total phenolic compounds
mg/L 4.77 2.35 1.20 0.09 0.04 0.02
arsenic
mg/L
0.3
0.2
0.1
0.9
0.5
0.2
chromium
mg/L 0.04 0.02 0.01 0.08 0.04 0.02
copper
mg/L 0.10 0.05 0.03
0.4
0.2
0.1


